Join Our Telegram channel to stay up to date on breaking news coverage
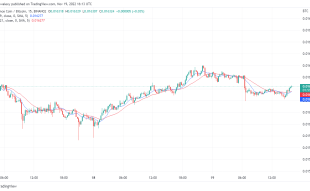
At the time of writing, the Bitcoin price prediction is dropping over 0.87% within 24 hours as it trades around the $16,537 level.
Bitcoin Prediction Statistics Data:
- Bitcoin price now – $16,537
- Bitcoin market cap – $318.2 billion
- Bitcoin circulating supply – 19.2 million
- Bitcoin total supply – 19.2 million
- Bitcoin Coinmarketcap ranking – #1
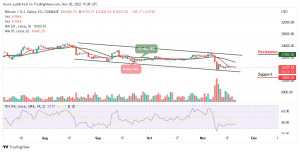
Bitcoin Price Long-term Trend: Bearish (Daily Chart)
Key levels:
Resistance Levels: $21,000, $23,000, $25,000
Support Levels: $13,000, $11,000, $9,000
The daily chart reveals that BTC/USD failed to break above the 9-day moving average as the king coin begins the day off by trending lower towards the support level of $16,400 and may likely cross the lower boundary of the channel. However, the first critical support level is located around $16,000. Beneath this, other supports could be found at $13,000, $11,000, and $9,000.
Bitcoin Price Prediction: Bitcoin (BTC) Could Trend Lower
As shown in the daily chart, the Bitcoin price fails to stay above the 9-day moving average as it looks to set up another few days of negative price declines beneath $16,000. Meanwhile, a break above the daily high at $16,733 would have set the king coin up to reach the nearest resistance at the $17,000 level. But, traders can see Bitcoin fails to break up as the technical indicator Relative Strength Index (14) heads to the east.
The Bitcoin price couldn’t go higher as it could drop towards the lower boundary of the channel. More so, should the technical indicator slide to the downside, the market price may end up facing the negative side. Nevertheless, any bullish movement above the 9-day and 21-day moving averages could hit the resistance levels at $21,000, $23,000, and $25,000.
BTC/USD Medium-term Trend: Ranging (4H Chart)
The 4-hour chart reveals that the Bitcoin price could face a sideways movement. Meanwhile, if the bulls step back and push the coin above the upper boundary of the channel, the Bitcoin price may hit the resistance level of $19,500 and above.
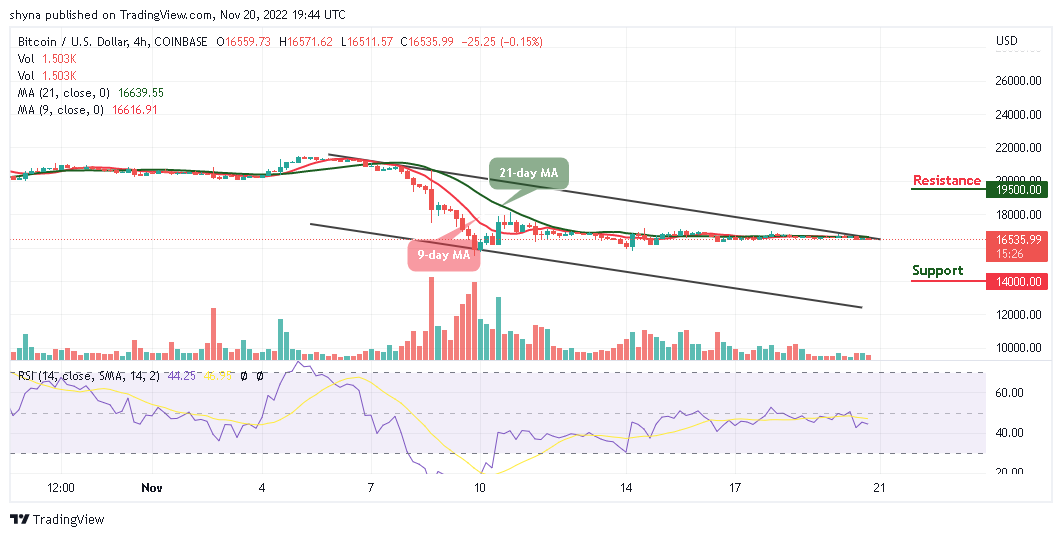
Nevertheless, if the sellers bring the current market value below the support level of $16,000, breaking this level may further allow the coin to hit the support at $14,000 and below. At the moment, the technical indicator Relative Strength Index (14) may likely cross below the 40-level to give additional bearish signals to the market.
Notwithstanding the above prediction, the Impact Token is still selling quickly, with more and more buyers showing interest. Pre-sales have been raising around $12.5 million in just a few weeks.
Similarly, Dash 2 Trade happens to be one of those few cryptos that have been performing relatively well despite what the king coin is passing through. This could be the best time to buy the D2T token, as the ongoing pre-sale has raised nearly $6.5 million so far.
Related
- D2T Price Prediction
- How to Buy D2T
Join Our Telegram channel to stay up to date on breaking news coverage