
Join Our Telegram channel to stay up to date on breaking news coverage
The Bitcoin price prediction shows that BTC is likely to cross below the lower boundary of the channel as the coin touches $16,534 support.
Bitcoin Prediction Statistics Data:
- Bitcoin price now – $16,579
- Bitcoin market cap – $319.4 billion
- Bitcoin circulating supply – 19.2 million
- Bitcoin total supply – 19.2 million
- Bitcoin Coinmarketcap ranking – #1
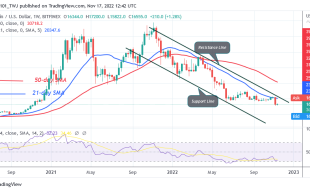
BTC/USD Long-term Trend: Ranging (Daily Chart)
Key levels:
Resistance Levels: $20,000, $22,000 $24,000
Support Levels: $14,000, $12,000, $10,000
BTC/USD could face a setback that could drag the coin below the lower boundary of the channel, and the king coin is likely to have an additional bearish run. Currently, Bitcoin (BTC) is trading around the $16,534 level after a free fall below the 9-day and 21-day moving averages.
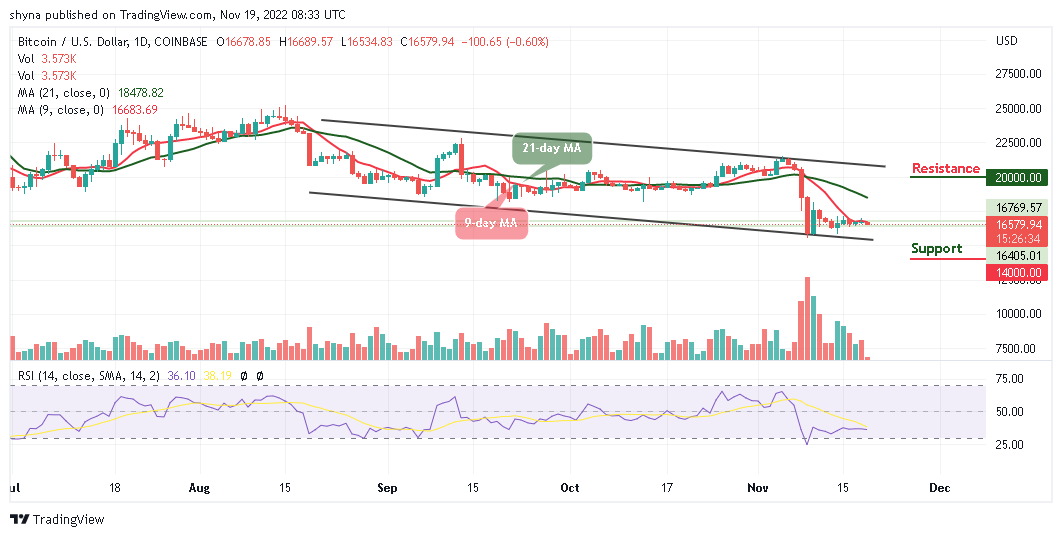
Bitcoin Price Prediction: Bitcoin (BTC) Price Resumes Drop
The Bitcoin price is currently trading bearishly below the moving averages. If the price should slump below the support level of $16,000, it is likely to face more downtrends. Meanwhile, the further bearish movement could locate the supports at $14,000, $12,000, and $10,000, making room for BTC to fall even further.
Nevertheless, the technical indicator Relative Strength Index (14) may into the oversold region as the trading volume could be in support of the bears. On the contrary, if bulls decide to move the price above the 9-day and 21-day moving averages, BTC/USD may locate the resistance levels at $20,000, $22,000, and $24,000.
BTC/USD Medium-term Trend: Ranging (4H Chart)
On the 4-Hour chart, the Bitcoin price is seen around the 9-day and 21-day moving averages and the immediate support is likely to come at the $16,000 level. However, the price may likely fall below this level if the bears continue to dominate the market.
Nevertheless, a further bearish movement could hit the critical support at the $14,500 level and below, while the resistance could be located above the channel at the resistance level of $19,500 and above. Meanwhile, the Bitcoin price is currently attempting to move into the positive side as the technical indicator Relative Strength Index (14) is likely to cross above the 50-level.
In addition, apart from the above analysis, the Impact Token is still selling quickly, with more and more buyers showing interest. Pre-sales have been raising around $12.5 million in just a few weeks.
The collapse of FTX brings about a need for a cutting-edge trading intelligence platform, and that exactly is what Dash 2 Trade offers. It is a platform that can adequately detect impending adverse issues similar to what happened to FTX, and thus enabling speculators to pinpoint secure occasions for good profits.
Similarly, Dash 2 Trade happens to be one of those few cryptos that have been performing relatively well despite what the king coin is passing through. This could be the best time to buy the D2T token, as the ongoing pre-sale has raised nearly $6.5 million so far.
Related
- D2T Price Prediction
- How to Buy D2T
Join Our Telegram channel to stay up to date on breaking news coverage