Join Our Telegram channel to stay up to date on breaking news coverage
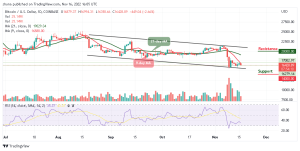
The Bitcoin price prediction shows that BTC is likely to cross below the lower boundary of the channel as the coin touches $16,358 support.
Bitcoin Prediction Statistics Data:
- Bitcoin price now – $16,428
- Bitcoin market cap – $317 billion
- Bitcoin circulating supply – 19.2 million
- Bitcoin total supply – 19.2 million
- Bitcoin Coinmarketcap ranking – #1
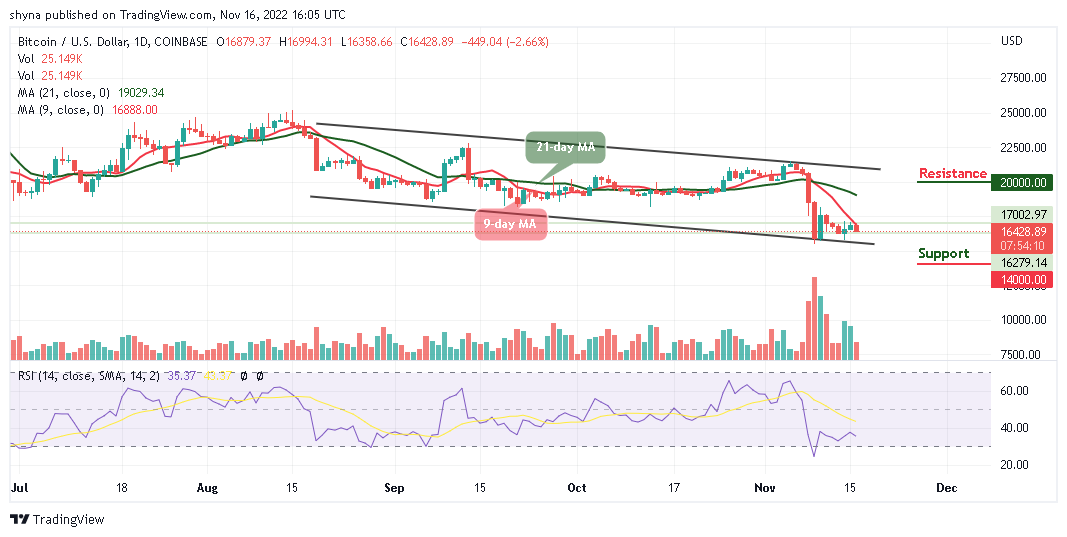
Bitcoin Price Long-term Trend: Ranging (Daily Chart)
Key levels:
Resistance Levels: $20,000, $22,000 $24,000
Support Levels: $14,000, $12,000, $10,000
BTC/USD may face a setback that could drag the coin below the lower boundary of the channel as the king coin is likely to have an additional bearish run. At the moment, the Bitcoin price is hovering around the $16,428 level after a free fall from the daily high of $16,994 during the European.
Bitcoin Price Prediction: Bitcoin (BTC) Heads to the Downside
The Bitcoin price is currently nose-diving below the 9-day and 21-day moving averages. If the price should slump below the support level of $16,000, it is likely to face a downward trend. Moreover, any further bearish movement could locate the supports at $14,000, $12,000, and $10,000, making room for BTC to fall even further.
In the meantime, the technical indicator Relative Strength Index (14) may remain below the 40-level as the trading volume could be in support of the bears. On the contrary, if bulls decide to push the price back above the 9-day moving average, BTC/USD may head towards the upper boundary of the channel to locate the resistance levels at $20,000, $22,000, and $24,000.
BTC/USD Medium-term Trend: Ranging (4H Chart)
On the 4-Hour chart, the Bitcoin price remains below the 9-day and 21-day moving averages and the immediate support is likely to come at the $16,000 level. However, the Bitcoin price may likely fall below this level if the bears begin to dominate the market.
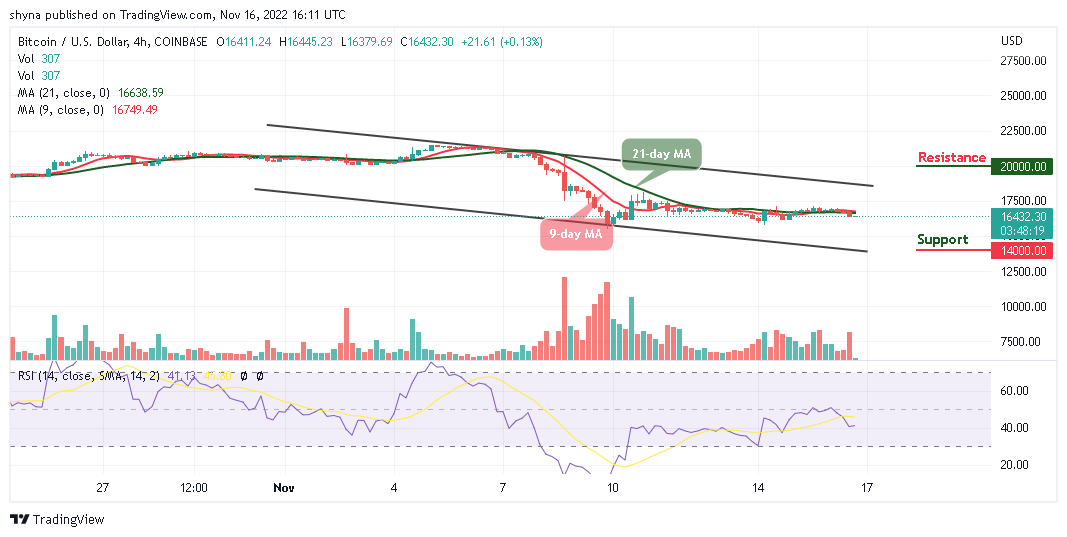
Meanwhile, a further bearish movement could hit the critical support at the $14,000 level and below, while the resistance could be located above the upper boundary of the channel at the resistance level of $20,000 and above. Meanwhile, the Bitcoin price is currently moving on the negative side as the technical indicator Relative Strength Index (14) may cross below the 40-level.
Many Investors Are Interested in IMPT Token
The Impact Token is still selling quickly, with more and more buyers showing interest. Pre-sales have been raising around $12.5 million in just a few weeks.
This Is the Best Time to Buy Dash 2 Trade (D2T)
This is the best time to buy the D2T token, and one of the reasons is that Binance’s CZ has already announced an industry turnaround plan for crypto projects. The ongoing pre-sale of Dash 2 Trade has raised nearly $6.5 million so far.
Related:
- D2T Price Prediction
- How to Buy D2T
Join Our Telegram channel to stay up to date on breaking news coverage