Join Our Telegram channel to stay up to date on breaking news coverage
The Solana price prediction is currently heading to the north and the dip is likely to worsen because of a recent decline in the crypto world.
Solana Prediction Statistics Data:
Solana price now – $40.5
Solana market cap – $13.8 billion
Solana circulating supply – 340.4 million
Solana total supply – 511.6 million
Solana Coinmarketcap ranking – #9
SOL/USD Market
Key Levels:
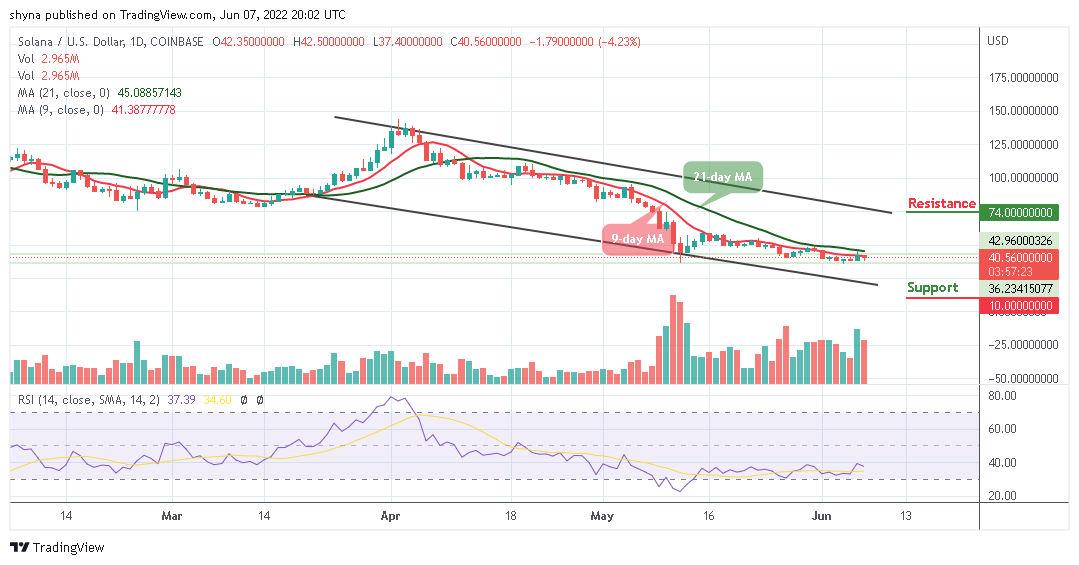
Resistance levels: $74, $76, $78
Support levels: $10, $8, $6
SOL/USD is moving sideways as the coin remains below the 9-day and 21-day moving averages. The Solana price is at the time of writing trading at $40.56, but crossing below the previous support of $37 may allow the coin to create another low within the market.
Solana Price Prediction: Would Solana Price Drop More?
The Solana price is currently ranging, but a cross below the lower boundary of the channel may increase the short-term selling pressure as the next critical supports may come at $10, $8, and $6. Meanwhile, any bullish movement above the 9-day and 21-day moving averages may reach the next potential resistance levels at $74, $76, and $78.
On the positive side, the technical indicators could start a new bullish session, but it is, however, not clear how long the session will last because, this month, both bullish and bearish sessions have been frequent. Therefore, it is important to watch the support level coupled with the movement of other indicators within the daily chart.
SOL/BTC Market: Bears Are Coming to Play
Compared with Bitcoin, the market price is heading to the downside as the coin is currently trading at 1299 SAT below the 9-day and 21-day moving averages. Looking at the daily chart, if the coin can make a cross above this barrier, the bulls may push the price towards the upper boundary of the channel. However, if the market drops more, the next key support may come at 8400 SAT and below.
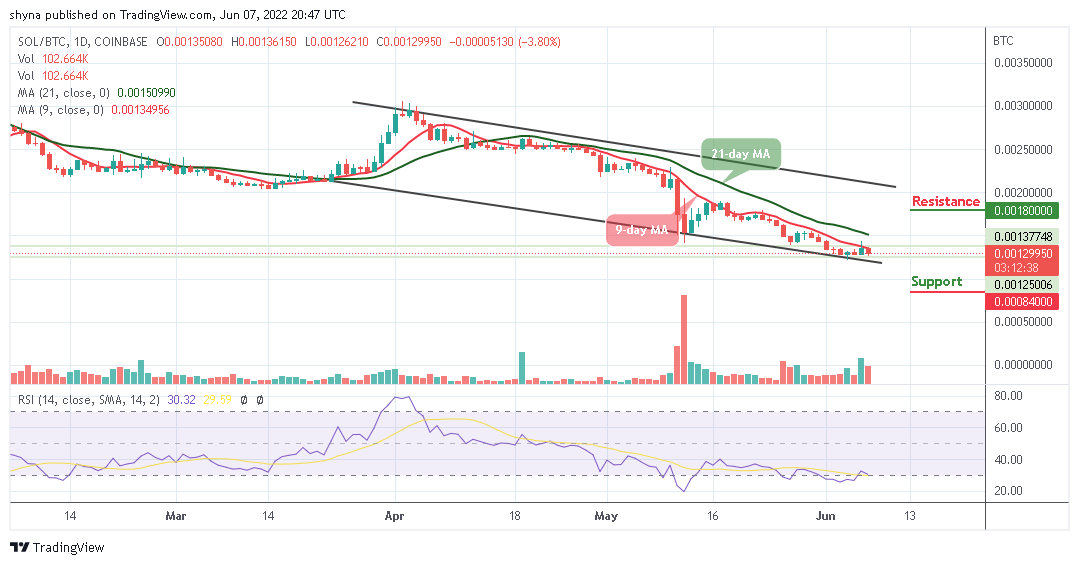
On the bullish side, a possible rise could push the market towards the upper boundary of the channel to hit the resistance level of 1800 SAT and above. As revealed by the technical indicator which is the Relative Strength Index (14), the market may continue the downward movement as the signal line moves to cross into the oversold region.
Join Our Telegram channel to stay up to date on breaking news coverage