
Join Our Telegram channel to stay up to date on breaking news coverage
The Bitcoin price prediction reveals that BTC is showing signs of market correction as its price moves below $30,000.
Bitcoin Prediction Statistics Data:
- Bitcoin price now – $29,489
- Bitcoin market cap – $562.3 billion
- Bitcoin circulating supply – 19.0 million
- Bitcoin total supply – 19.0 million
- Bitcoin Coinmarketcap ranking – #1
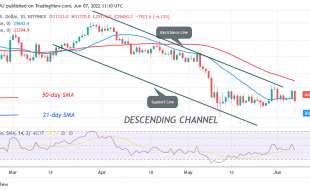
BTC/USD Long-term Trend: Bearish (Daily Chart)
Key levels:
Resistance Levels: $35,000, $37,000, $39,000
Support Levels: $26,000, $24,000, $22,000
BTC/USD is currently trading below the $29,500 level as the price crosses below the 9-day and 21-day moving averages. Meanwhile, the heavy bearish movement could be coming to play out according to the technical indicator, which indicates that the king coin might likely drop a little more before climbing above the upper boundary of the channel.
Bitcoin Price Prediction: Would Bitcoin (BTC) Still Cross to the Higher Ground?
At the time of writing, the Bitcoin price is changing hands at $29,489, which marks a significant rally below the moving averages. However, where BTC trends next may depend on whether or not sellers can close today’s candle below the $29,000 level. Meanwhile, should in case this comes to play, the bears could drag the prices lower. According to the daily chart, traders may expect the king coin to fall below $29,000 support which could later move towards the critical support levels of $26,000, $24,000, and $22,000.
On the other hand, if the Bitcoin price failed to close below the $29,000 level; the price may bounce back above the 9-day and 21-day moving averages, and crossing above the upper boundary of the channel could send the price to the resistance levels of $35,000, $37,000, and $39,000. More so, the technical indicator Relative Strength Index (14) recently reveals a sign of trend reversal, which shows a possible bearish momentum in the market soon.
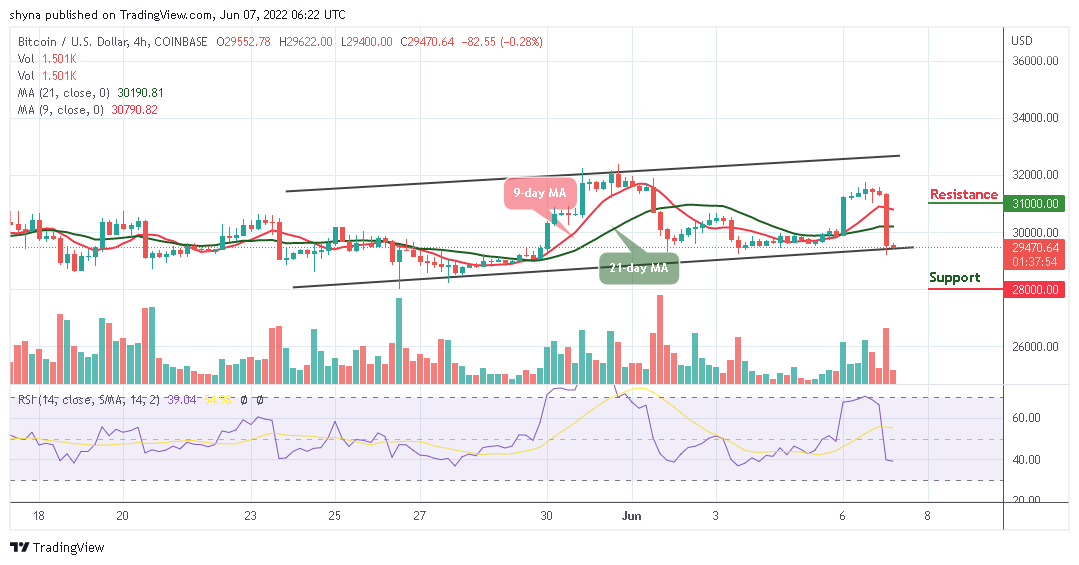
BTC/USD Medium-Term Trend: Ranging (4H Chart)
On the 4-hour chart, BTC/USD is currently trading around $29,470 below the 9-day and 21-day moving averages as the Bitcoin price moves to cross below the lower boundary of the channel.

However, if the buyers regroup and energize the market, they can bring the price back above the 9-day moving average which could take the market price to the resistance level of $31,000 and above. Meanwhile, the Relative Strength Index (14) is currently moving below the 40-level, and any further bearish movement below this level could make the price hit the support level of $28,000 and below.
Read more:
- How to buy Bitcoin
- How to buy Cryptocurrency
Join Our Telegram channel to stay up to date on breaking news coverage