Join Our Telegram channel to stay up to date on breaking news coverage
Solana Price Prediction – June 18
The SOL/USD trade price is likely to lose more at $30 as there have been lower lows in the downward direction on a slow and steady moving pattern. The percentage rate of trading is at 6.39 negative. And the market is between the $31 and $27 value lines.
Solana (SOL) Statistics:
SOL price now – $27.49
SOL market cap – $9.5 billion
SOL circulating supply – 342.3 million
SOL total supply – 511.6 million
Coinmarketcap ranking – #9
SOL/USD Market
Key Levels:
Resistance levels: $40, $50, $60
Support levels: $20, $15, $10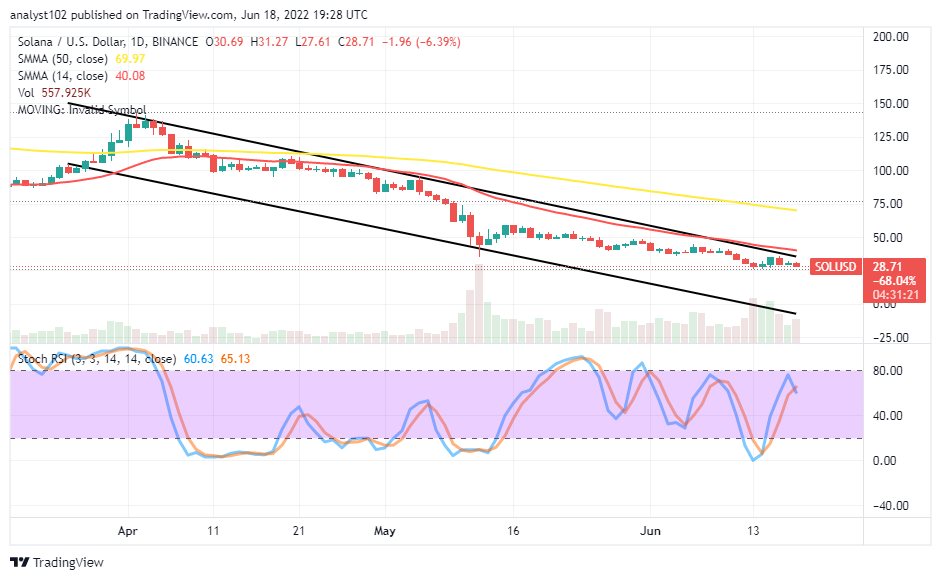 SOL/USD – Daily Chart
The daily chart showcases the SOL/USD market is likely to lose more at $30, making use of the trend line of the smaller SMA to decide when it will be ideal for selling orders. The upper bearish trend line drew southward to keep a tight closure on the path the bearish candlesticks have been following underneath the SMA trend lines. The 50-day SMA indicator is above the 14-day SMA indicator. The Stochastic Oscillators are trying to cross southbound closely below the range of 80 to signify a declining move in the offing.
Will the SOL/USD market keep featuring under the SMAs for more sessions?
The SOL/USD market operation tends to maintain featuring under the SMAs for more sessions as headlined the crypto economy is likely to lose more around the $30 level. The reading of the Stochastic Oscillators has also given a little trait in support of that assumption. Therefore, buying position orders will have to suspend for a while until another trading outlook suggests exhaustion of a downward-trending motion afterward.
On the downside of the technical analysis, the current trading situation appears to bag a sell signal against getting a reliable buying order around the trend line of the 14-day SMA. The actual resistant-trading value as indicated by the SMA is around $40. In the meantime, a sell signal has been observed coming at an earlier stage closely beneath the point. Sellers may decide to take a position provided the move doesn’t rebound against the current motion forcefully in no time.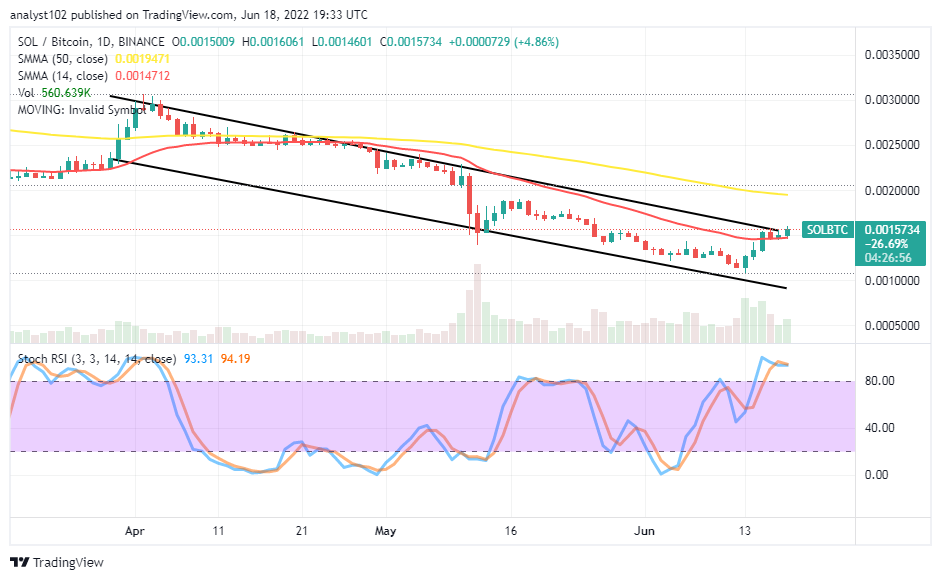
SOL/BTC Price Analysis
Solana’s trending capacity compared with Bitcoin’s appears striving to regain some stances as variant bullish candlesticks have occurred from the beneath of the smaller SMA, trying to break through it further to the north side, as at the time of writing. The cryptocurrency pair price is likely to lose if it eventually hits resistance between the spaces of the SMAs. The 14-day SMA indicator is underneath the 50-day SMA indicator. The Stochastic Oscillators are in the overbought region. And they have closed the lines within to indicate the probability of witnessing a resumption of falling force.
Looking to buy or trade Solana (SOL) now? In-Content Heroes link!
68% of retail investor accounts lose money when trading CFDs with this provider.
Read more:
Join Our Telegram channel to stay up to date on breaking news coverage