Join Our Telegram channel to stay up to date on breaking news coverage
Solana Price Prediction – July 28
It appears the Solana market trades sideways feebly against the market worth of the US Dollar. The crypto price trades around $40 at an average minimal percentage rate of 0.40 negative. During yesterday’s operations, the price recorded a low of $35.76 and a high of $40.38.
Solana (SOL) Statistics:
SOL price now – $40.85
SOL market cap – $14 billion
SOL circulating supply – 346 million
SOL total supply – 511.6 million
Coinmarketcap ranking – #9
SOL/USD Market
Key Levels:
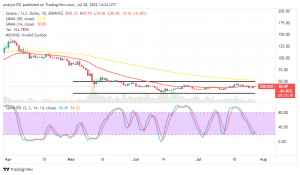
Resistance levels: $50, $55, $60
Support levels: $25, $20, $15 SOL/USD – Daily Chart
The daily chart reveals the crypto-economic price trades sideways feebly within the range-bound zones of $25 and $50. The 50-day SMA indicator is at $52.25, near over the upper range line drawn, and the 14-day SMA trading indicator is underneath them at the $38.85 level. The Stochastic Oscillators have moved southbound toward the range of 20, trying to cross back northbound from the range spot. Expectations are gradually increasing to suggest price is taking its time to run in another direction.
Can there be a breakout at the $50 resistance upper range level of the SOL/USD market soon?
The SOL/USD market trading pace has only been posing a bullish-promising outlook presently within the range-bound zones of $25 and $50. And the price may not sustainably break out at the upper range point as the crypto economy trades sideways feebly. Long-position takers have to use either a 1-hour or 4-hour time frame to decide an appropriate period to determine when to enter a buying order at a lower-trading spot that has to be backed by price action.
On the downside of the technical analysis, the upper range value line at $50 will be the main resistance area where selling activities will decently take a course. Contrary to that technical assumption, the positional reading of the Stochastic Oscillators in an overbought region without the market pushing northward to the value line may result in a prompt resumption of a downward-trending force within the range-bound zones.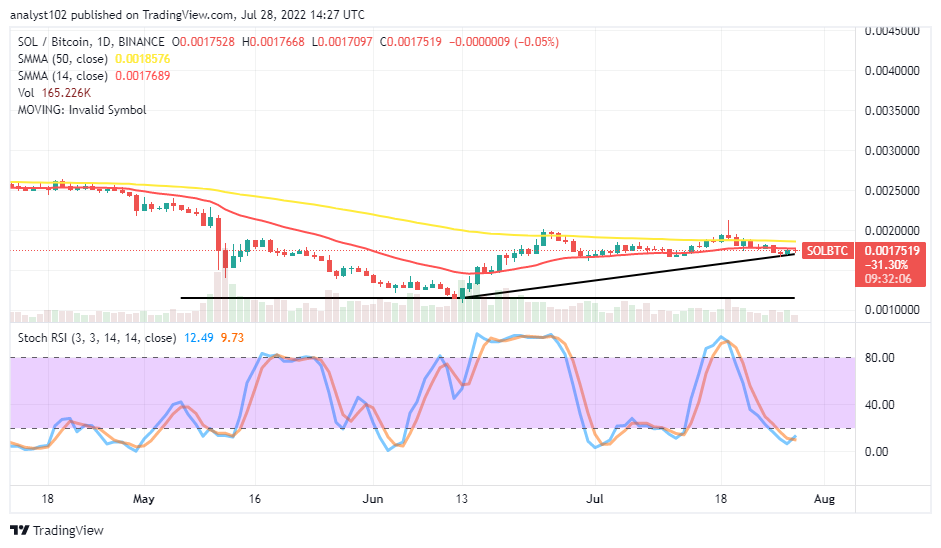
SOL/BTC Price Analysis
In comparison, the first instance shows Solana is somewhat waxing stronger against the pushing ability of Bitcoin in the market. Secondly, the cryptocurrency pair trades sideways feebly around the trend line of the SMAs. The 14-day SMA indicator is underneath the 50-day SMA indicator. The bullish trend line drew to mark the point showing where a downward force tends to get exhaustion near underneath the smaller SMA. The Stochastic Oscillators are in the oversold region, seemingly trying to cross the lines northbound within to show the base crypto hasn’t given up to its counter-trading crypto.
Read more:
Join Our Telegram channel to stay up to date on breaking news coverage