
Join Our Telegram channel to stay up to date on breaking news coverage
The Solana price prediction is currently heading to the south and the dip is likely to worsen because of a recent decline within the market.
Solana Prediction Statistics Data:
Solana price now – $40.8
Solana market cap – $14.0 billion
Solana circulating supply – 345.7 million
Solana total supply – 511.6 million
Solana Coinmarketcap ranking – #9
SOL/USD Market
Key Levels:
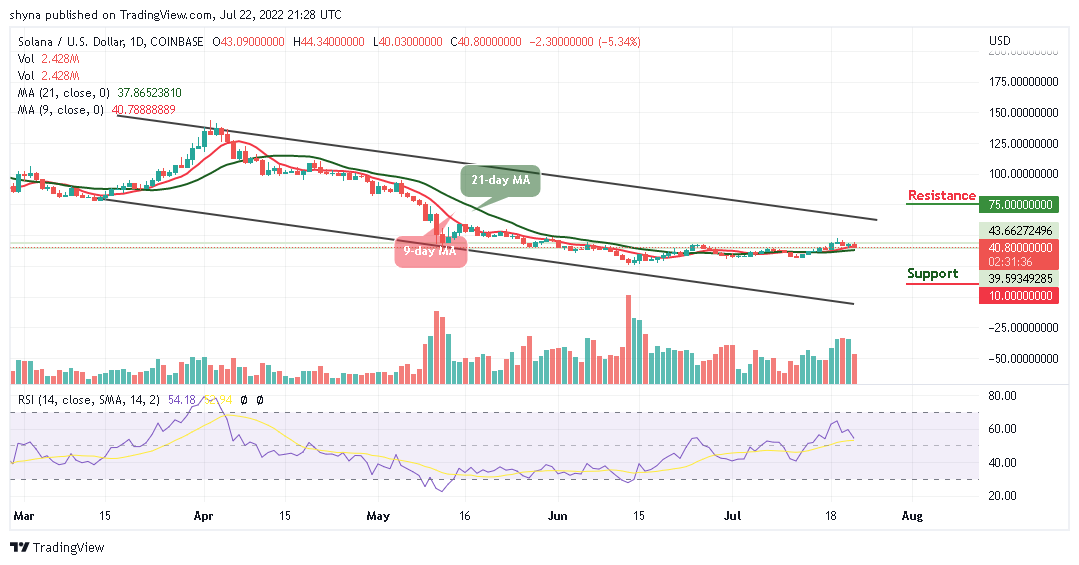
Resistance levels: $75, $77, $79
Support levels: $10, $8, $6
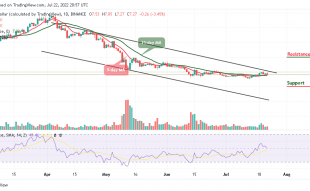
SOL/USD may follow the bearish movement as the coin moves to cross below the 9-day and 21-day moving averages. The Solana price is at the time of writing trading at $40.8. Any further bearish movement below the support of $40 may create another low within the market.
Solana Price Prediction: Solana (SOL) May Drop More
The Solana price is currently ranging, but a cross below the moving averages may increase the short-term selling pressure and the next critical supports may come at $10, $8, and $6 respectively. Meanwhile, if the coin decides to follow the bullish movement, staying above the 9-day and 21-day moving averages may touch the potential resistance levels at $75, $77, and $79.
Nonetheless, the technical indicators could start a new bullish session, but it is, however, not clear how long the session will last. Therefore, it is important to watch the support level coupled with the movement of other indicators within the daily channel to confirm the next direction that the coin may follow.
SOL/BTC Market: Bears May Come to Play
Compared with Bitcoin, the market price may head to the downside as the coin trades at 1795 SAT within the 9-day and 21-day moving averages. If the Solana price makes a cross above the upper boundary of the channel, it may touch the nearest resistance at 2000 SAT. However, if the market drops more, the next key support may come at 1200 SAT and below.
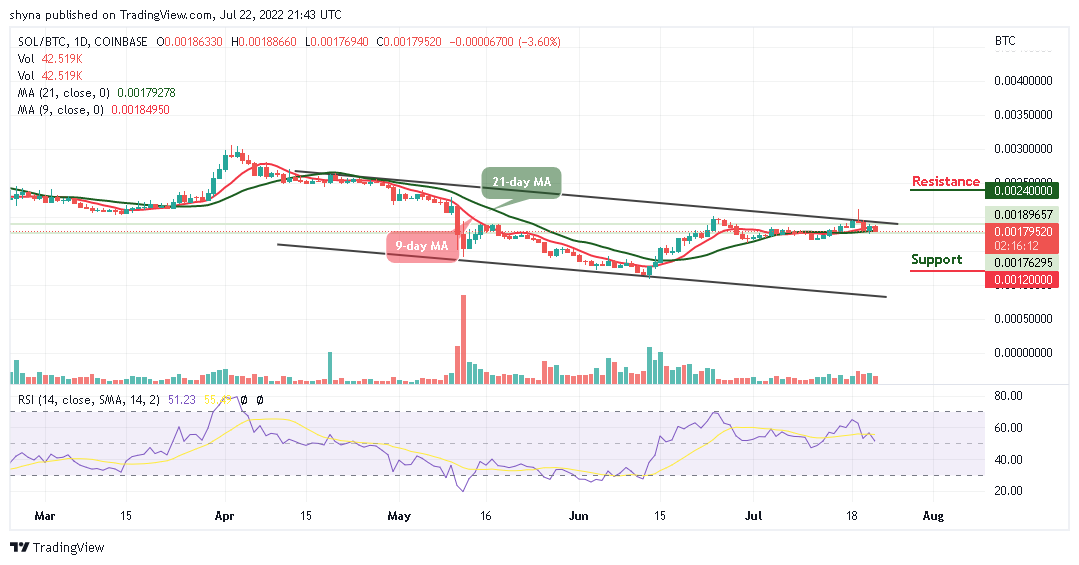
On the bullish side, a possible rise could push the market above the channel to hit the resistance level of 2400 SAT and above. The technical indicator Relative Strength Index (14) may confirm the downward movement if the signal line crosses below 50-level.
Join Our Telegram channel to stay up to date on breaking news coverage