Join Our Telegram channel to stay up to date on breaking news coverage
The Solana price prediction remains on the negative side, as the coin heads toward the lower boundary of the channel.
Solana Prediction Statistics Data:
- Solana price now – $35.
- Solana market cap – $12 billion
- Solana circulating supply – 345.4 million
- Solana total supply – 511.6 million
- Solana Coinmarketcap ranking – #9
SOL/USD Market
Key Levels:
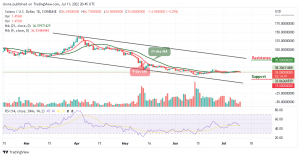
Resistance levels: $70, $75, $80
Support levels: $15, $10, $5
SOL/USD is back in the middle of consolidation as the coin drops below the 9-day and 21-day moving averages. The Solana price is now roaming around the $35 level. However, if the market continues the down-surge, the $30 support may surface in the next few negative moves.
Solana Price Prediction: Solana Price Heads to the South
The Solana price is currently trading below the 9-day and 21-day moving averages as the technical indicator Relative Strength Index (14) moves below the 50-level. Meanwhile, the coin may either move sideways or create a new low by sliding to the downside.
Therefore, if SOL/USD gains more downsides, the Solana price may locate the support levels of $15, $10, and $5 respectively. On the upside, if the bulls step back and push the coin above the 9-day and 21-day moving averages, moving towards the upper boundary of the channel could locate the potential resistance levels at $70, $75, and $80.
SOL/BTC Market: Price May Head to the Downside
Against Bitcoin, the Solana price may remain below the 9-day and 21-day moving averages if the coin head to the downside. Although, the price is not forming an upward trend on the daily chart as bulls are attempting to recover the coin back higher. However, the Solana price is likely to create an additional downtrend if the bulls keep the coin below the moving averages. On the contrary, any bullish movement above the upper boundary of the channel could take the coin to the resistance level of 2400 SAT and above.
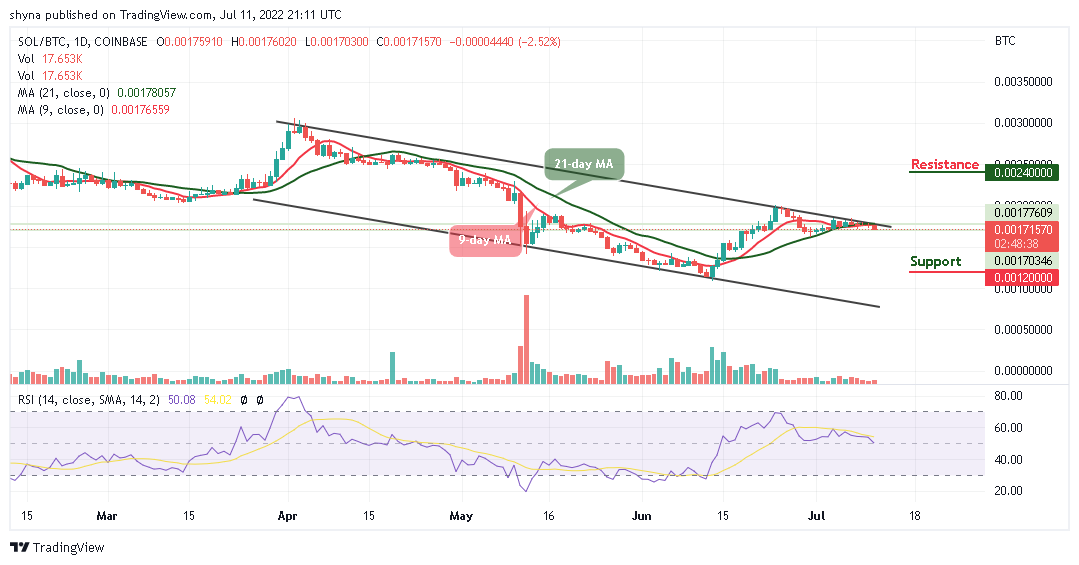
Looking at the current technical indicator Relative Strength Index (14) on the daily chart, it appears that bears are likely to come into focus if the signal line moves below the 40-level. Meanwhile, if the Solana price heads toward the lower boundary of the channel, it could hit the support level of 1200 SAT and below.
Join Our Telegram channel to stay up to date on breaking news coverage