Join Our Telegram channel to stay up to date on breaking news coverage
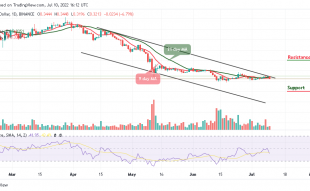
The Solana price prediction shows that SOL may dig dip because of a recent decline below the moving averages.
Solana Prediction Statistics Data:
- Solana price now – $36.8
- Solana market cap – $12.7 billion
- Solana circulating supply – 345.2 million
- Solana total supply – 511.6 million
- Solana Coinmarketcap ranking – #9
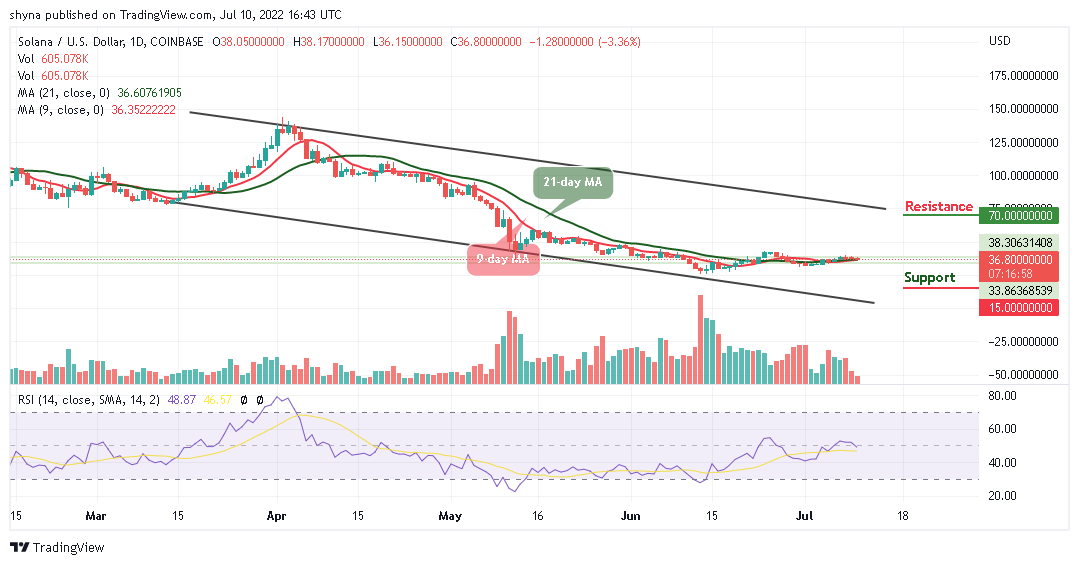
SOL/USD Market
Key Levels:
Resistance levels: $70, $75, $80
Support levels: $15, $10, $5
SOL/USD is ranging as the coin may cross below the 9-day and 21-day moving averages trading around $36.80. However, the Solana price may not cross into the positive side but currently consolidating around the support level of $36.
Solana Price Prediction: Where is Solana Price Going Next?
The Solana price is moving sideways, and with all indications, the coin is likely to follow the downtrend. Any bearish movement towards the lower boundary of the channel may increase the short-term selling pressure, while the next supports may come around $15, $10, and $5. Meanwhile, any bullish movement towards the upper boundary of the channel may locate the next resistance levels at $70, $75, and $80.
On the positive side, the technical indicators could start a new bullish session if the Relative Strength Index (14) remains above 50-level. It is, however, not clear how long the session will last because, at the time of writing, the market price keeps moving in the range and it is important to watch the resistance and support levels coupled with the movement of other indicators within the daily chart to confirm the next direction that the coin will face.
SOL/BTC Market: Solana Price May Spike to the Upside
Compared with Bitcoin, the market price is moving sideways as the coin trades at 1770 SAT within the 9-day and 21-day moving averages. Looking at the daily chart, if the coin can make a cross above this barrier, the bulls may push the price towards the upper boundary of the channel. Nevertheless, if the market drops below the current market value, the next key support may come at 1400 SAT and below.
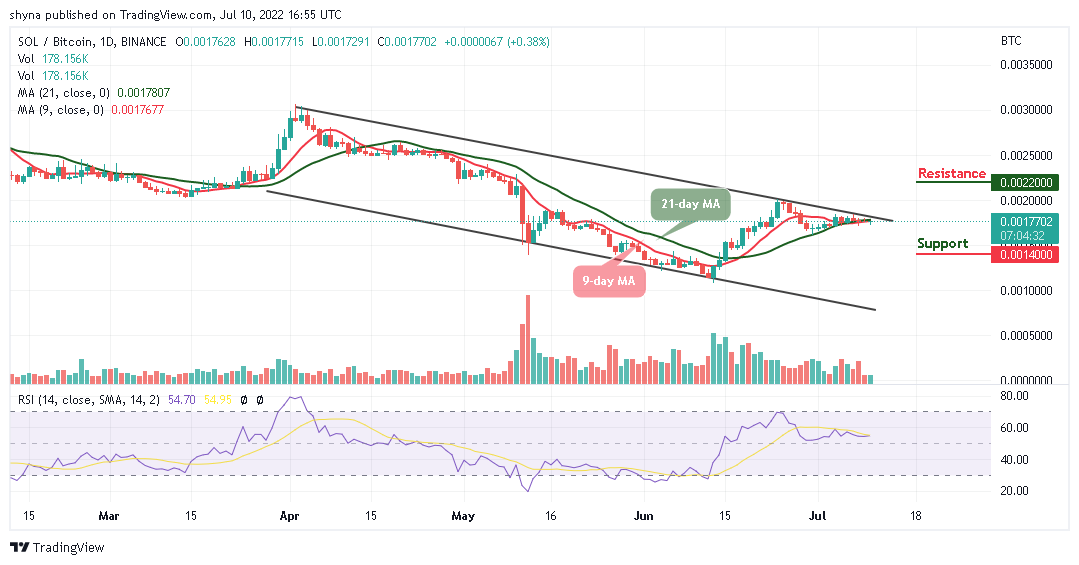
On the bullish side, a possible rise may push the market above the upper boundary of the channel to hit the resistance level of 2200 SAT and above. As revealed by the technical indicator the Relative Strength Index (14), the market is moving sideways as the signal line moves above the 50-level.
Join Our Telegram channel to stay up to date on breaking news coverage