Join Our Telegram channel to stay up to date on breaking news coverage
The Solana price prediction shows that SOL heads toward the upper boundary of the channel as the coin touches the $12.99 level.
Solana Prediction Statistics Data:
- Solana price now – $12.96
- Solana market cap – $4.7 billion
- Solana circulating supply – 367.8 million
- Solana total supply – 537.6 million
- Solana Coinmarketcap ranking – #15
SOL/USD Market
Key Levels:
Resistance levels: $25, $27, $29
Support levels: $5, $3, $1
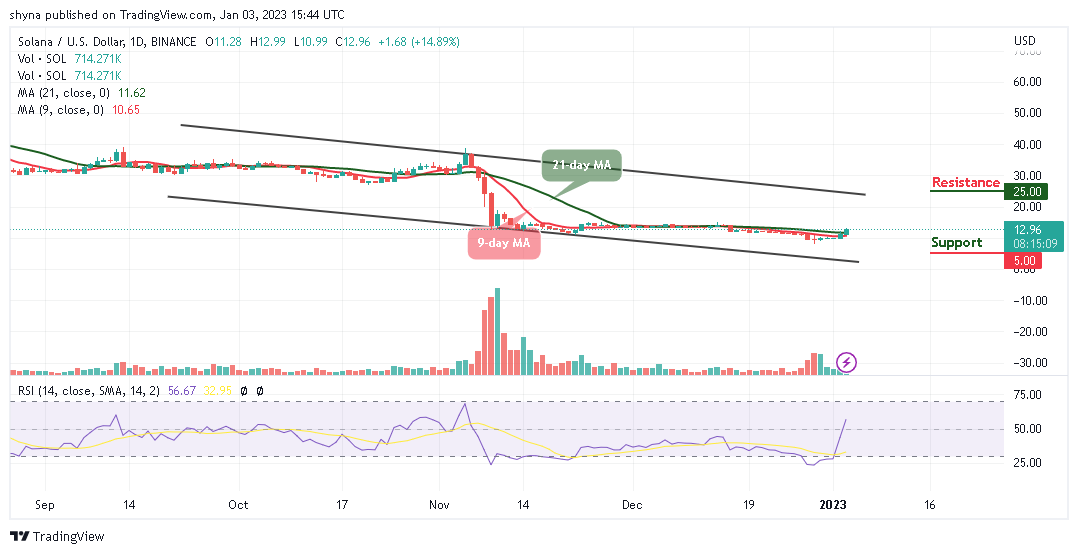
SOL/USD is currently trading at $12.96 after touching the daily low of $10.99 and it is likely to head toward the upper boundary of the channel. However, if the buyers were able to keep the price above the 9-day and 21-day moving averages, the market price could rally toward the upside.
Solana Price Prediction: Solana Gets Ready for Upward Movement
According to the daily chart, the Solana price is moving close to the resistance level of $15 as the coin prepares to create an additional gain. The technical indicator Relative Strength Index (14) is also moving to cross above the 60-level with the signal line pointing up to indicate a buy signal.
Nevertheless, if the buyers were able to keep the price above the 9-day and 21-day moving averages, the Solana price may cross above the upper boundary of the channel to hit the potential resistance levels of $25, $27, and $29 while crossing below the moving averages may bring the coin to the supports at $5, $3, and $1 respectively.
Against Bitcoin, the Solana price is moving upward, and it could swing high to cross above the upper boundary of the channel which could locate the resistance level of 1200 SAT and above. On the other hand, if the market price slides below the 9-day and 21-day moving averages, it could reach the support level of 150 SAT and below.
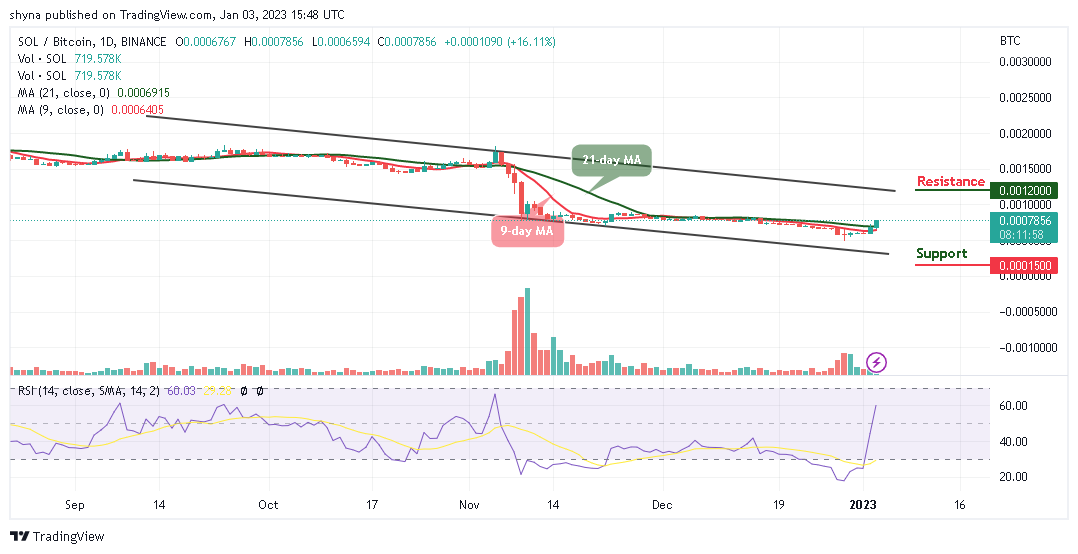
However, the technical indicator Relative Strength Index (14) is currently moving to cross above the 60-level as the signal line points to the north to confirm the bullish movement. Moreover, any further bullish movement towards the upside may create additional gains within the channel.
Meanwhile, Dash 2 Trade gives you the ability to optimize your trading and speculative profitability with effective crypto trading recommendations, auto trading, and analytics features. There is a D2T token presale ongoing and time is running out. The presale dashboard launch is coming soon since the product dev is ahead of the schedule. Therefore, almost $12.5 million has been raised so far.
Related
Join Our Telegram channel to stay up to date on breaking news coverage