Join Our Telegram channel to stay up to date on breaking news coverage
SHIB is consolidating
SHIBUSD Price Analysis – October 02
When the sellers’ momentum increase and break down $0.000010 level, SHIB may decrease further to $0.000009 levels and the support level of $0.000008 may be reached. Should the buyers defend the support level of $0.000010, price may increase and penetrate $0.000011 upside, $0.000012 and $0.000013 may be tested.
Key levels:
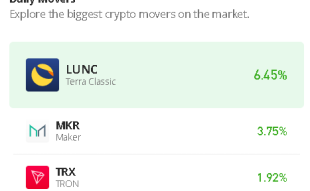
Resistance levels: $0.000011, $0.000012, $0.000013
Support levels: $0.000010, $0.000009, $0.000008
SHIBUSD Long-term Trend: Ranging
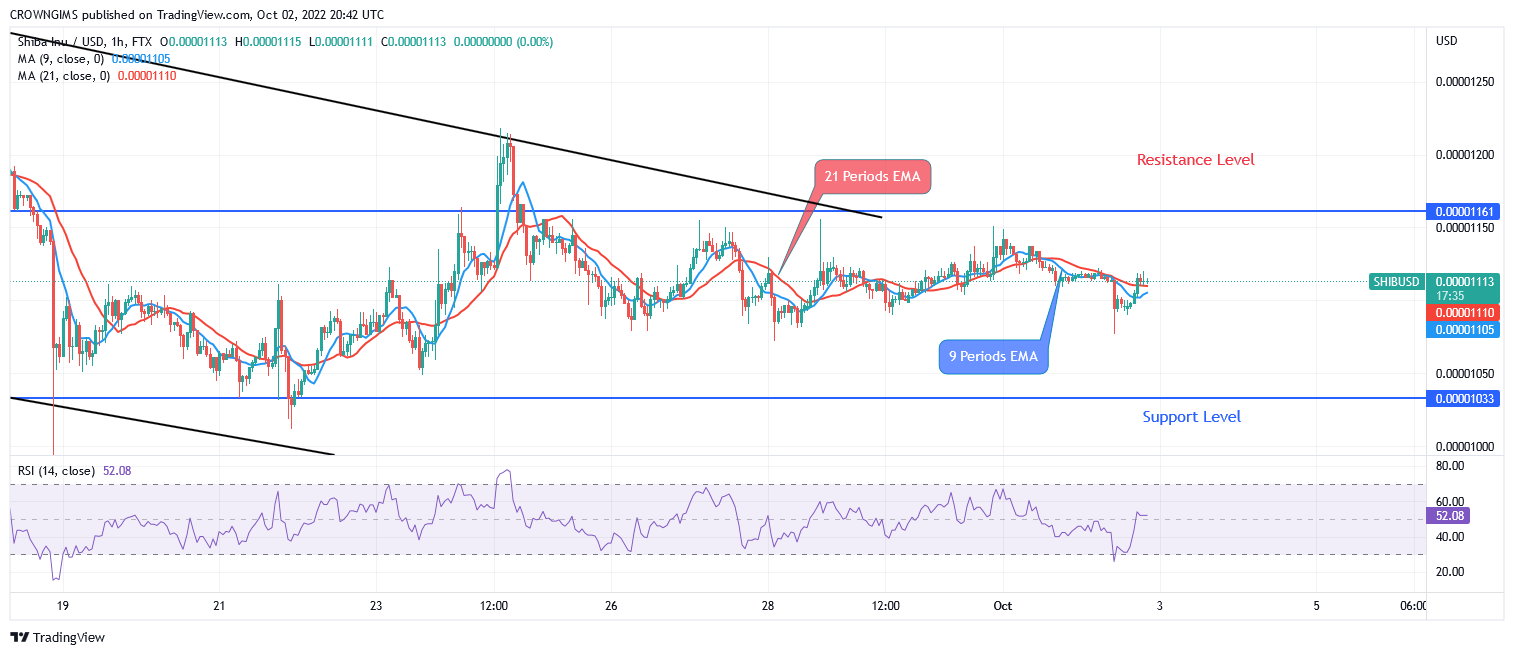
On the daily chart, SHIBUSD is on the ranging movement. When the crypto reaches the support level of $0.000010, the sellers lose pressure and could not break down the mentioned support level. The buyers were not able to break up the resistance level of $0.000011. The price is trading within the resistance level of $0.000011 and the support level of $0.000010. SHIB may break out soon.

The price is trading between the two EMAs as a sign of ranging movement. The fast Moving Average (9 periods EMA) has crossed the slow Moving Average (21 periods EMA) downside. When the sellers’ momentum increase and break down $0.000010 level, price may decrease further to $0.000009 levels and the support level of $0.000008 may be reached. Should the buyers defend the support level of $0.000010, price may increase and penetrate $0.000011 upside, $0.000012 and $0.000013 may be tested. However, the relative strength index period 14 is at 44 levels displaying no specific direction.
Your capital is at risk
SHIBUSD medium-term Trend: Ranging
SHIBUSD is ranging in the 4-hour chart. The support level of $0.000010 and the resistance level of $0.999911 holds the price. This is what led to ranging movement within the price levels mentioned above. The price is currently consolidating around the resistance level of $0.000011.
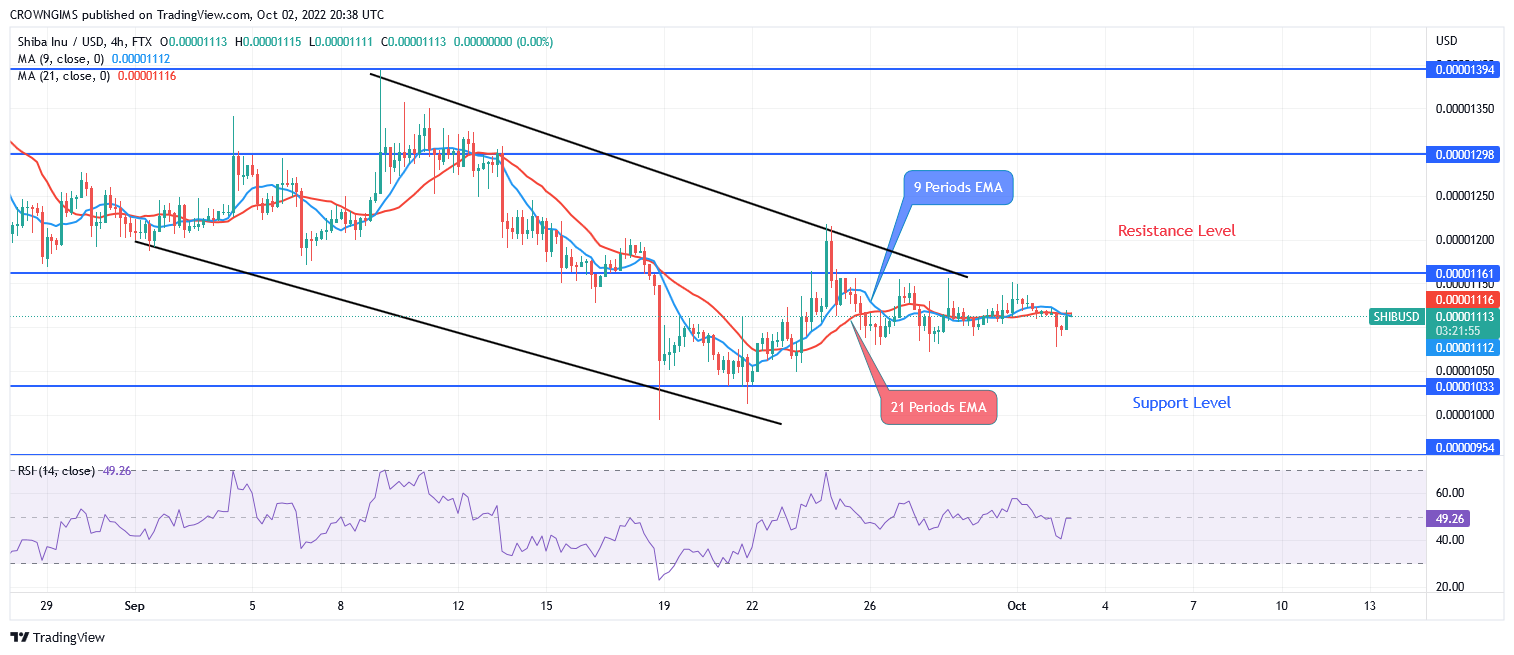
The coin is trading around the 21 periods EMA and 9 periods EMA. The two EMAs are interlocked to each other which indicates a low momentum in Shiba Inu market. The relative strength index period 14 is at 47 levels and the signal lines is exhibiting buy signal.
Join Our Telegram channel to stay up to date on breaking news coverage