

Join Our Telegram channel to stay up to date on breaking news coverage
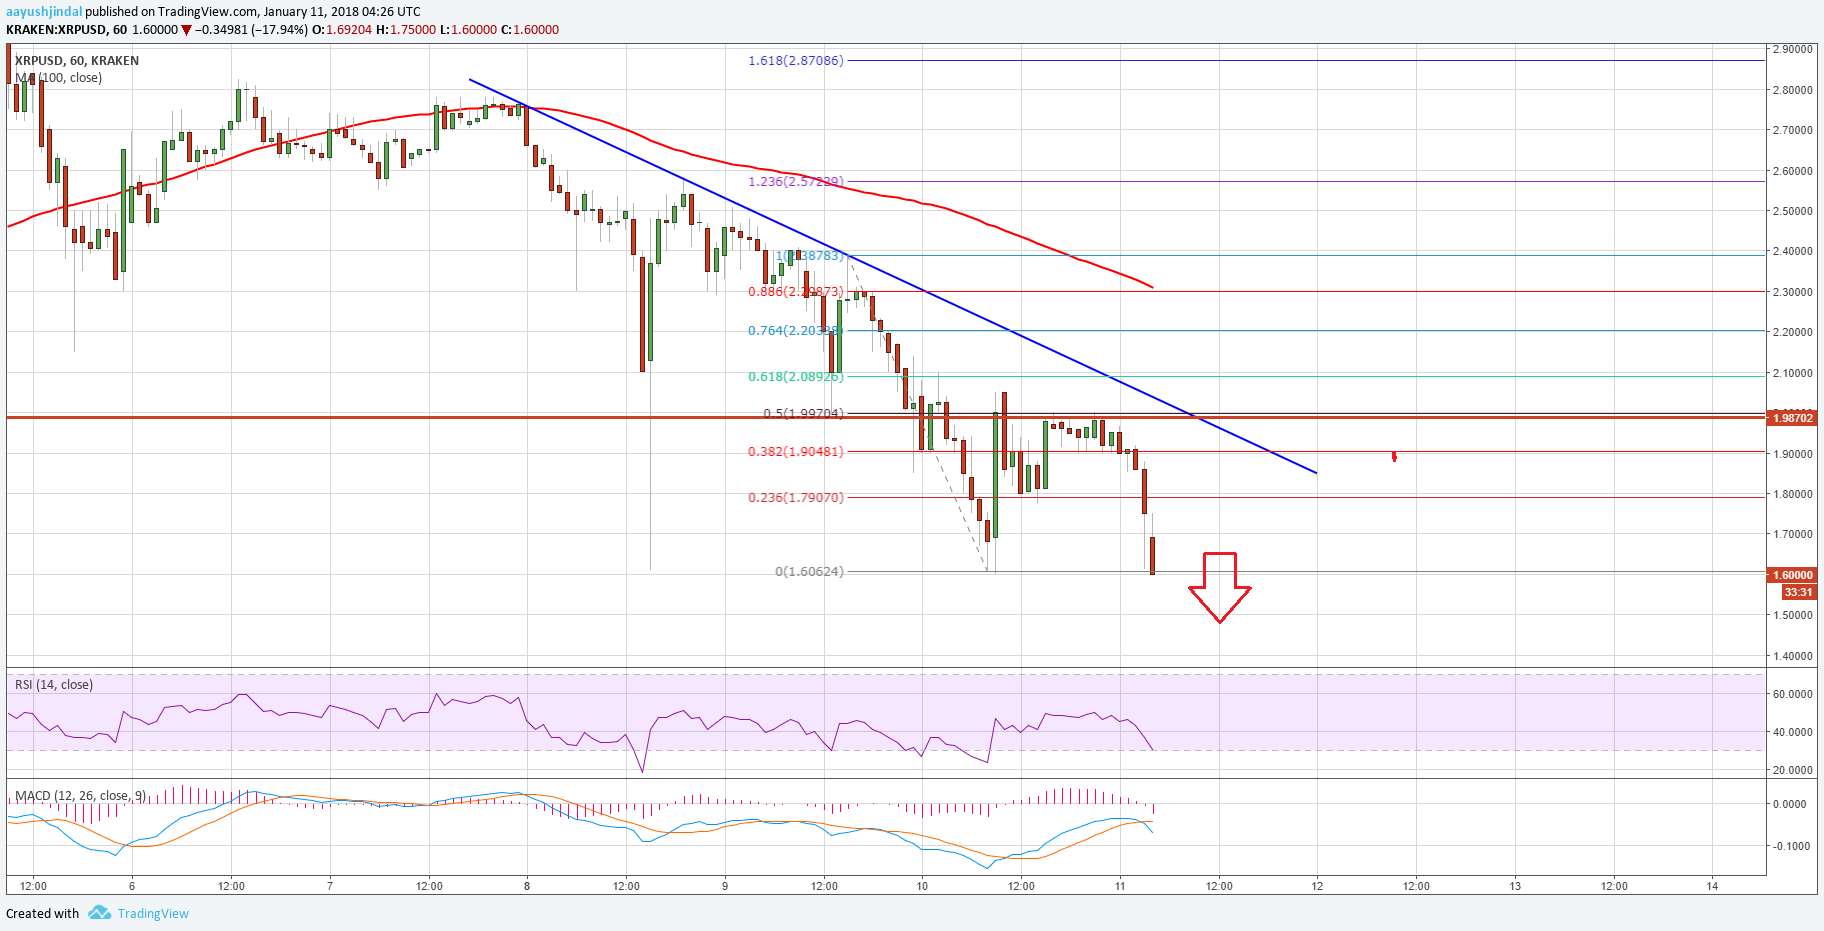
Key Highlights Ripple price extended declines and moved below the $1.80 support against the US Dollar. Yesterday’s highlighted crucial bearish trend line with current resistance at $1.85 is still in place on the hourly chart of the XRP/USD pair (data source from Kraken). The price continues to move down and it could soon break the 1.60 low to for more losses.
Ripple price faced a lot of selling pressure against the US Dollar and Bitcoin. XRP/USD could accelerate declines and it may soon test or break the $1.50 level.
Ripple Price Decline
It seems like the current bearish pressure is here to stay on Ripple price below $2.00 against the US Dollar. The price was under a lot of pressure and it moved below the $1.80 and $1.70 support levels. The downside move is strong and the price is now below the $1.65 level. Recently, there was a recovery from the $1.6062 swing low with a break of the 23.6% Fib retracement level of the last decline from the $2.38 high to $1.60 low.
However, the upside move was capped by the $2.00 handle. Moreover, the 50% Fib retracement level of the last decline from the $2.38 high to $1.60 low also acted as a resistance. More importantly, yesterday’s highlighted crucial bearish trend line with current resistance at $1.85 is still in place on the hourly chart of the XRP/USD pair. It may continue to act as a strong barrier for buyers above $2.00. As long as the price is below the $2.00 handle, it remains at a risk of more losses below $1.60.
A break below the $1.60 level could open the doors for a test of the $1.50 level. Below the $1.50 level, there is a chance an extension towards the $1.40 level.
Looking at the technical indicators:
Hourly MACD – The MACD for XRP/USD is now placed in the bearish zone.
Hourly RSI (Relative Strength Index) – The RSI for XRP/USD is heading lower towards the 25 level.
Major Support Level – $1.50
Major Resistance Level – $2.00
Charts courtesy – Trading View, Kraken
The post Ripple Price Technical Analysis – XRP/USD Bearish U-Turn appeared first on NewsBTC.
Join Our Telegram channel to stay up to date on breaking news coverage