

Join Our Telegram channel to stay up to date on breaking news coverage
Key Highlights Ripple price moved higher recently and traded above the $0.9000 resistance against the US dollar. There was a break above a connecting bearish trend line with resistance at $0.9110 on the hourly chart of the XRP/USD pair (data source from Kraken). The pair traded as high as $0.9488 where it faced sellers and declined once again.
Ripple price was not able to capitalize on gains against the US Dollar and Bitcoin. XRP/USD is back below the 100 hourly SMA and the $0.9200 support.
Ripple Price Support
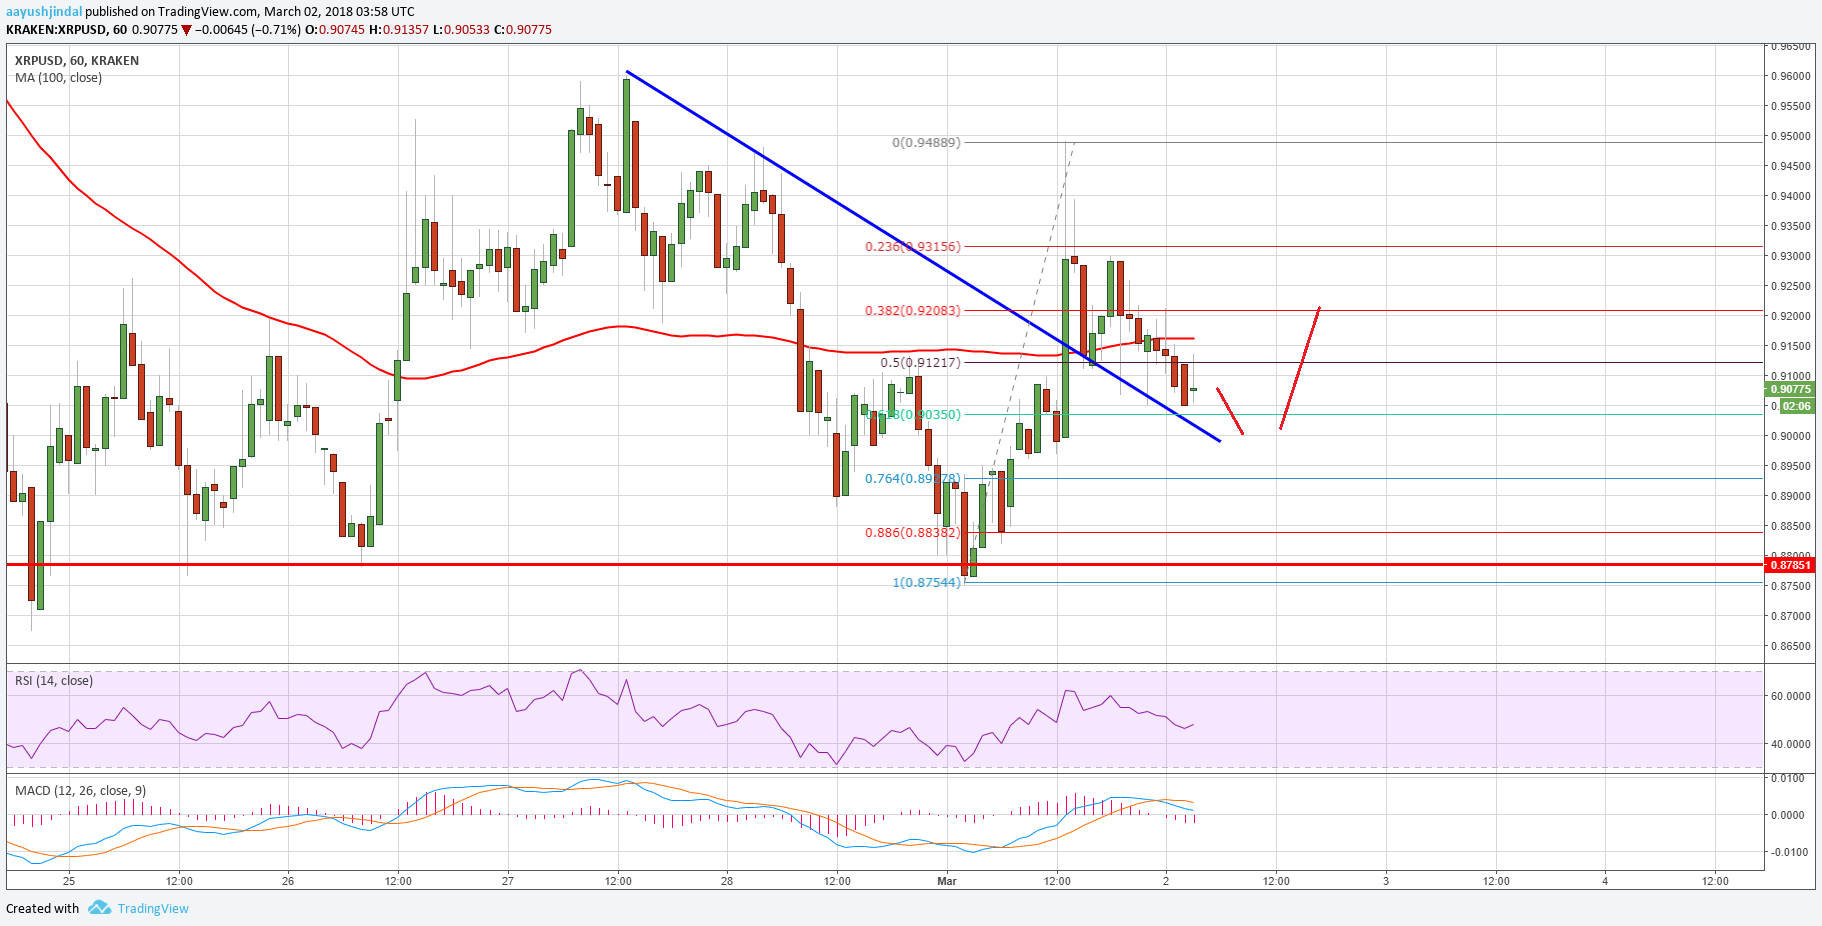
There was a minor upside move initiated from the $0.8700 swing low in Ripple price against the US Dollar. The price moved higher and broke the $0.9000 resistance. There was also a break above the $0.9200 resistance and the 100 hourly simple moving average. Buyers pushed the price above the 50% Fib retracement level of the last drop from the $0.9597 high to $0.8749 low.
During the upside, there was a break above a connecting bearish trend line with resistance at $0.9110 on the hourly chart of the XRP/USD pair. However, the upside move was capped by the $0.9500 resistance. A high was formed near $0.9488 from where the price started a fresh downside wave. The decline was substantial as the price moved below the 50% Fib retracement level of the last wave from the $0.8754 low to $0.8488 high. Moreover, there was a close below the $0.9200 level and the 100 hourly SMA.
It seems like the price was able to capitalize on gains above $0.9200 and declined. It is currently trading near the same broken trend line at $0.9080, which is acting as a support. As long as the price is above $0.9050, it could make another upside attempt.
Looking at the technical indicators:
Hourly MACD – The MACD for XRP/USD is now back in the bearish zone.
Hourly RSI (Relative Strength Index) – The RSI for XRP/USD has moved below the 50 level.
Major Support Level – $0.9050
Major Resistance Level – $0.9200
Charts courtesy – Trading View
The post Ripple Price Technical Analysis – Can XRP/USD Gain Momentum? appeared first on NewsBTC.
Join Our Telegram channel to stay up to date on breaking news coverage