Join Our Telegram channel to stay up to date on breaking news coverage
XRP Price Prediction – June 21
The daily chart reveals that XRP/USD is yet to break above the moving averages as the price couldn’t gather enough momentum.
XRP/USD Market
Key Levels:
Resistance levels: $0.200, $0.205, $0.210
Support levels: $0.175, $0.170, $0.165
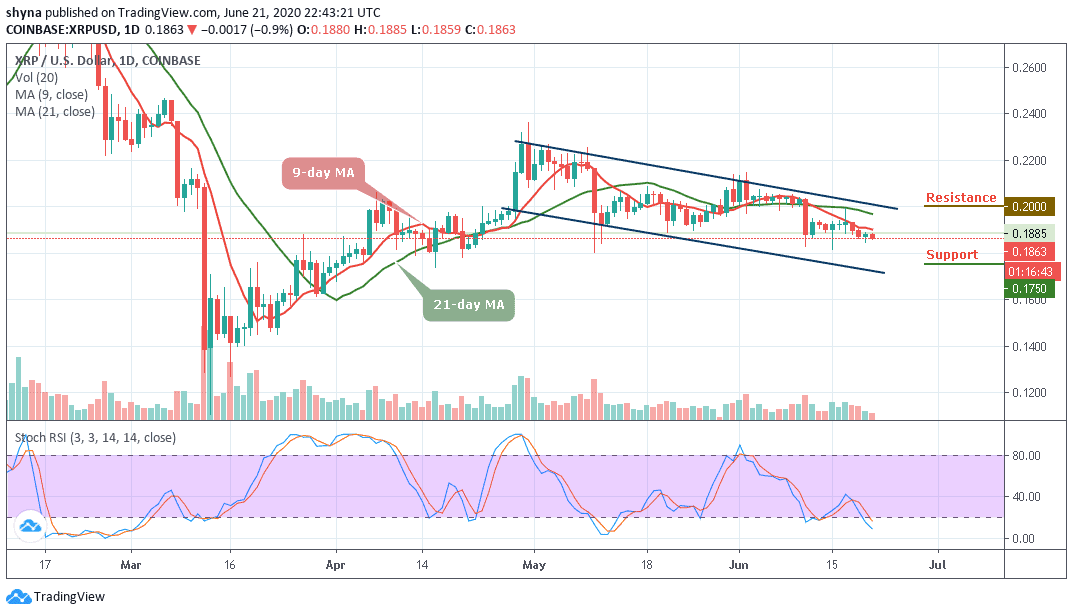
XRP/USD has not been able to break above the $0.190 level. Today, the price absorbed stops located below $0.188 and slips to $0.186 in a matter of minutes. While the price is trying to recover from the losses trading at $0.186.3 with 0.9% gains from the beginning of the day. Meanwhile, XRP/USD needs to regain ground above $0.190 to mitigate the bearish pressure.
However, as the price to buy Ripple (XRP) hovers at $0.186.3, any attempt to make it trade below this level may open the doors for more downsides and the price could spike below the $0.185 support level. However, traders should keep an eye on the $0.180 before creating a new bearish trend at the support levels of $0.175, $0.170, and $0.165.
In other words, for the upside, the buyers may need to make a sustainable move above the moving averages as soon as possible to negate an immediate bearish scenario. More so, for the upside to gain traction, the coin needs to regain ground above $0.198, while $0.200, $0.205, and $0.210 resistance levels are the ultimate aims for the bulls. More so, the technical indicator RSI (14) suggests that the market may continue to follow the bearish movement.
Against Bitcoin, the Ripple (XRP) is moving on the downside within the descending channel. If the selling pressure persists, the XRP price variation may continue to bring a new low. At the moment, the RSI (14) is seen moving into the oversold zone; more negative movements may come to play as the pair trades under the moving averages.
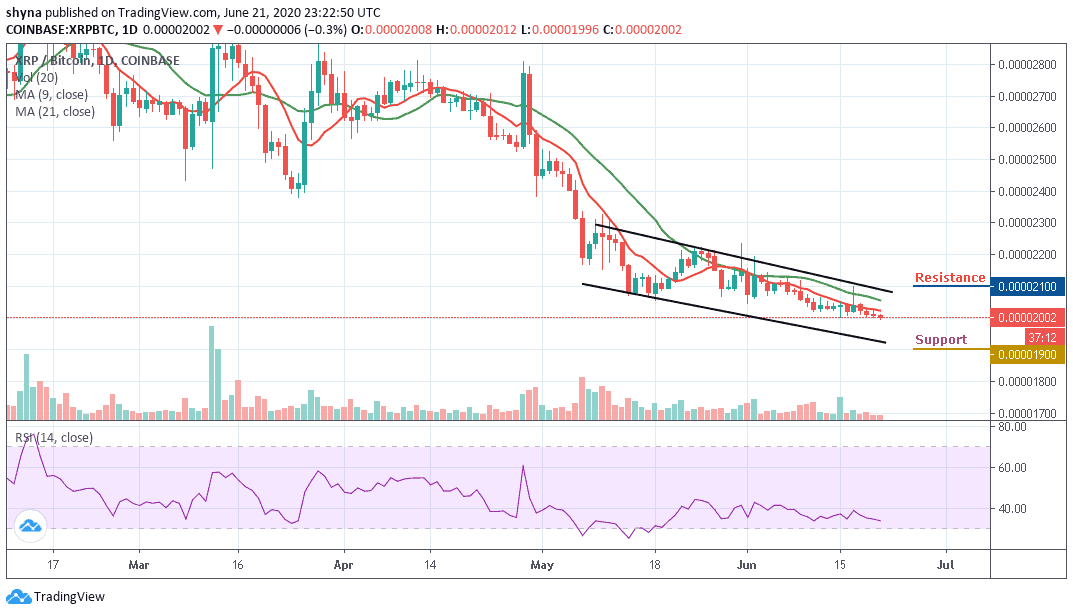
However, traders may expect close support at the 1950 SAT before breaking to the 1900 SAT and below. Any bullish movement that may occur could validate a break above the moving averages within the channel; we can then confirm a bull-run for the market and the nearest resistance levels lie at 2100 SAT and above.
Join Our Telegram channel to stay up to date on breaking news coverage