


Join Our Telegram channel to stay up to date on breaking news coverage
Ripple Price Prediction – July 7
The Ripple price has been unable to develop the upside momentum above $0.70 as the coin range-bounds.
XRP/USD Market
Key Levels:
Resistance levels: $0.95, $1.05, $1.15
Support levels: $0.40, $0.30, $0.20
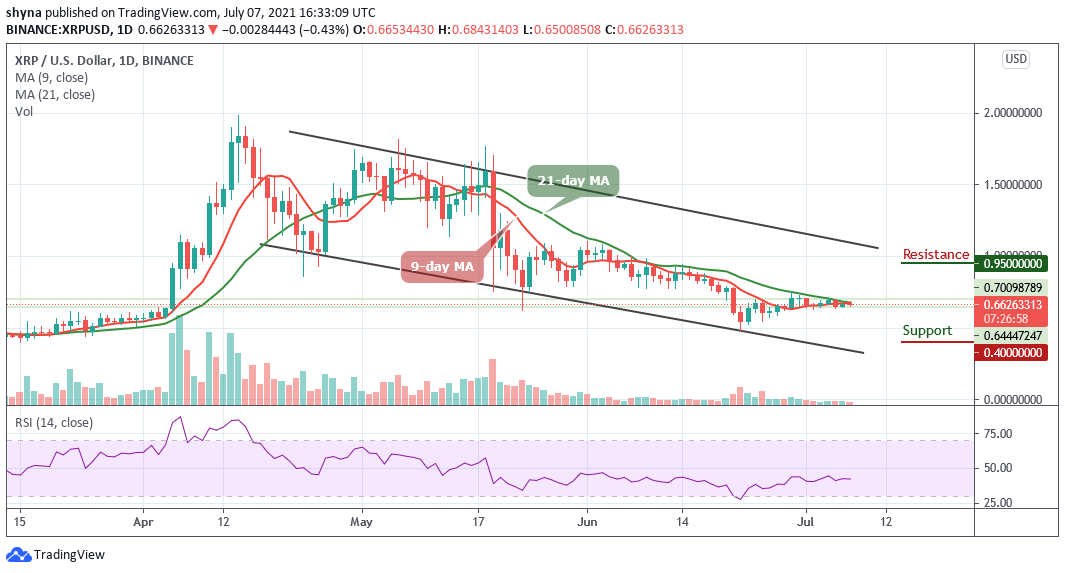
XRP/USD touches the resistance level of $0.68 at the opening of the market today, but the coin failed to keep the upward movement as it quickly retreated towards $0.65 support. Nonetheless, the Ripple (XRP) has been moving sideways since June 24 and the coin still remains at a tight range which limited its bullish movements above the 9-day and 21-day moving averages.
Ripple Price Prediction: What could be the Next Direction?
According to the daily chart, the Ripple price keeps following the same direction towards the east. However, if the bulls manage to push the Ripple price above the 9-day and 21-day moving averages; they could find the resistance at $0.40, $0.30, and $0.20 levels.
Meanwhile, if the market follows the bearish movement, it may likely hit the nearest support at $0.50 and a further drop could pull XRP/USD to the support levels of $0.40, $0.30, and $0.20 respectively. Moreover, the technical indicator Relative Strength Index (14) confirms the sideways movement as the signal line stays below 45-level. Therefore, traders should keep monitoring the movement for the next possible direction of the Ripple price.
When compares with Bitcoin, the Ripple price is also seen moving sideways, although the price action has remained intact below the 9-day and 21-day moving averages. Meanwhile, if the selling pressure persists, the Ripple price variation may likely create a new low for the coin in the next coming trading days.
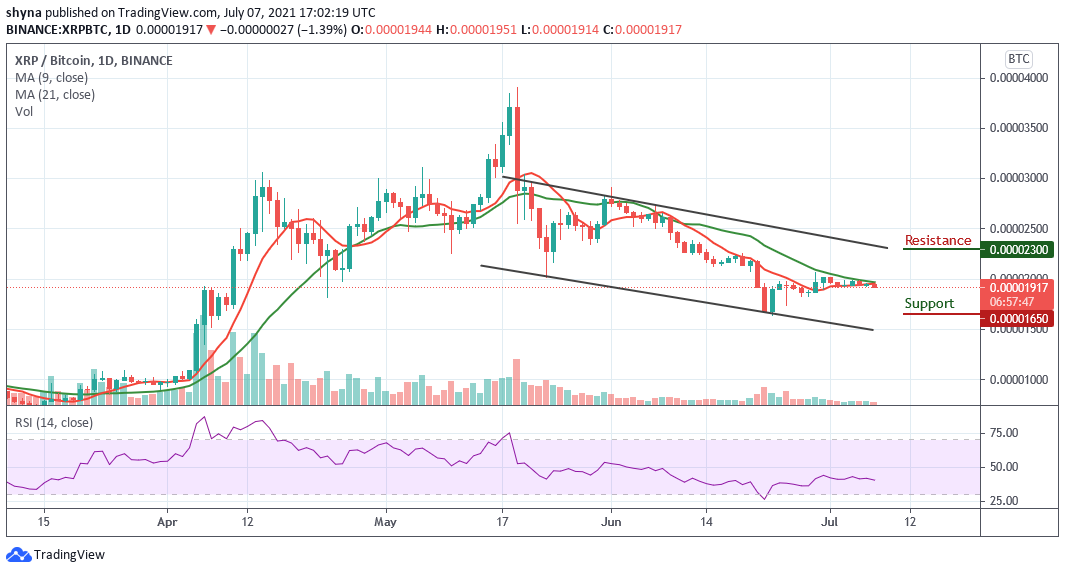
At the moment, the technical indicator Relative Strength Index (14) is seen moving in the same direction; traders may likely see a negative move if the bears step back into the market and they should expect close support at the 1700 SAT. However, any further bearish movement towards the lower boundary of the channel could drag the coin to the critical support of 1650 SAT and below. On the other hand, if a bullish movement occurs and validates a break above the 9-day and 21-day moving averages; traders may confirm a bullish movement for the market, and the closest resistance level may be located at 2300 SAT and above.
Looking to buy or trade Ripple (XRP) now? Invest at eToro!
75% of retail investor accounts lose money when trading CFDs with this provider
Join Our Telegram channel to stay up to date on breaking news coverage
