Join Our Telegram channel to stay up to date on breaking news coverage
Ripple Price Prediction – March 21
The daily chart reveals that the Ripple price is rising above the moving averages by 4.18% as the value touches the daily high at $0.85.
XRP/USD Market
Key Levels:
Resistance levels: $1.00, $1.05, $1.10
Support levels: $0.65, $0.60, $0.55
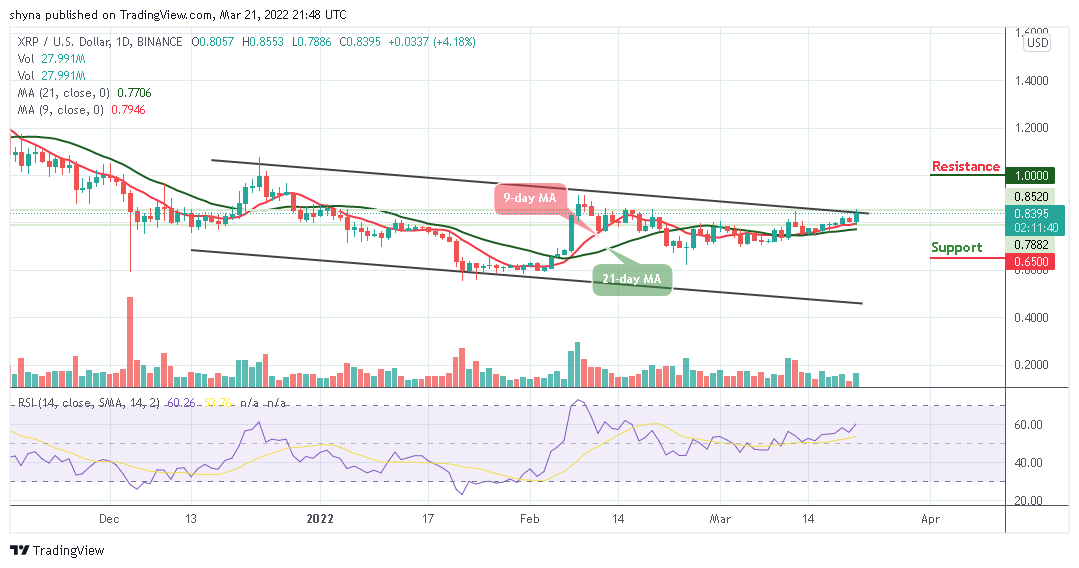
XRP/USD is rising above the 9-day moving average as the coin might cross above the 21-day moving average. After struggling to stay above $1.00, the Ripple price begins to move towards the upper boundary of the channel to probably move into a short-term bullish zone.
Ripple Price Prediction: Ripple (XRP) Ready for the Upside
At the time of writing, the Ripple price is currently exchanging hands at $1.01, and any attempt to make it cross above the 21-day moving average may bring more upsides as the price could stay at the upside.
In addition, traders may need to wait for a strong bullish cross above the 9-day and 21-day moving averages before creating additional bullish trend towards the potential resistance levels of $1.20, $1.25, and $1.30 respectively.
However, XRP/USD may experience more spikes once the trade reaches the resistance at $0.95. But if the bulls failed to push the price to the upside, a bearish breakdown is likely to trigger another selling opportunity for traders, which could cause the coin to touch the support level of $0.75 and could further drop to $0.65, $0.60, and $0.55 support levels. Meanwhile, the technical indicator Relative Strength Index (14) is crossing above 60-level, suggesting more bullish signals for the market.
When compared with BTC, the Ripple price is rising above the 9-day and 21-day moving averages. If the buying pressure continues, the Ripple (XRP) may create a new high as the technical indicator Relative Strength Index (14) moves to cross above 60-level. Therefore, traders may expect the potential resistance at 2300 SAT and above if the coin cross above the upper boundary of the channel.
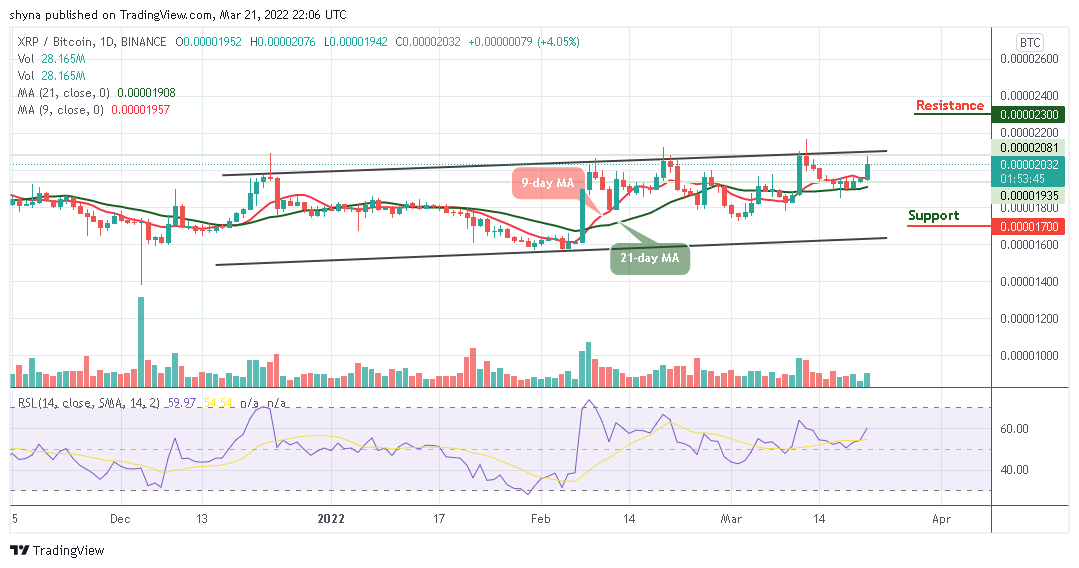
However, if a bearish movement triggers below the moving averages; traders can confirm a bearish movement for the market, and it could locate the support level at 1700 SAT and below.
Looking to buy or trade Ripple (XRP) now? Invest at eToro!
68% of retail investor accounts lose money when trading CFDs with this provider
Join Our Telegram channel to stay up to date on breaking news coverage