Join Our Telegram channel to stay up to date on breaking news coverage
XRP Price Prediction – February 12
XRP/USD bulls are taking further strides to the north after breaking out of the channel. The coin is trading in positive territory, with gains of 5.50%.
XRP/USD Market
Key Levels:
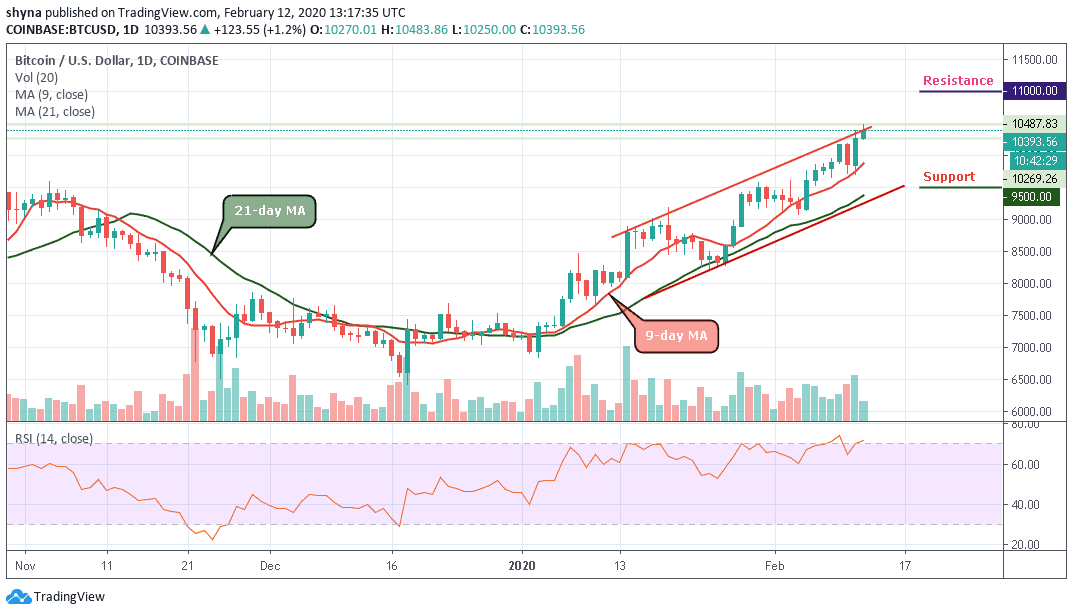
Resistance levels: $0.330, $0.340, $0.350
Support levels: $0.260, $0.250, $0.240
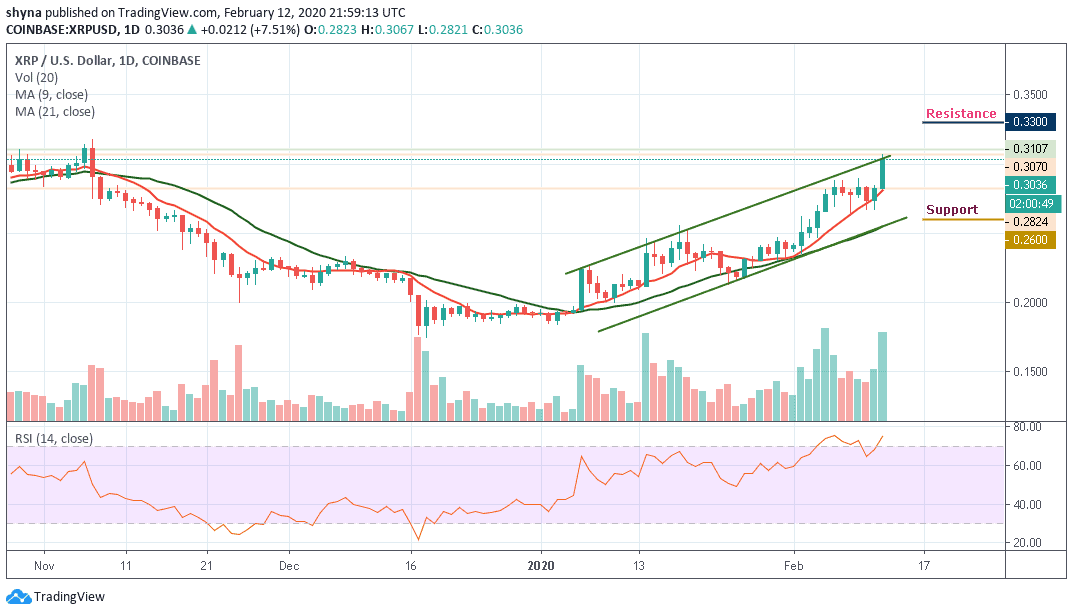
The Ripple’s XRP broke above $0.300 for the first time since November 2019 and the coin hit the new high of 2020 at $0.307. At the time of writing, XRP/USD is changing hands at $0.303 amid strong bullish pressure. From the technical point of view, the upside trend stays remains as long as the price stays above $0.282 which is the bottom of the previous retreat. If this level is broken, the sell-off may gain traction with the next focus on $0.280 and $0.270.
In addition, XRP/USD must break above the resistance at $0.320 to continue its bullish drive higher. However, should in case the price falls beneath $0.280, the market may likely turn neutral. Similarly, a drop beneath the 9-day moving average within the ascending channel could turn it bearish.
Moreover, as RSI (14) revisits the overbought condition, we must keep eye on the $0.310 and $0.320 before creating a new bullish trend at the resistance levels of $0.330, $0.340 and $0.350. Conversely, if the price falls below the $270 support, a bearish breakout may trigger more selling pressure for the market, which might cause the price to retest $0.260 and could further drop to $0.250 and $0.240 support levels respectively.
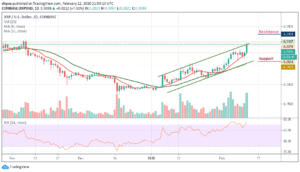
When compared with BTC, XRP is still consolidating within the channel, moving above the 9-day and 21-day moving averages. Meanwhile, should in case the bulls maintain the upward movement, the coin may cross the upper boundary of the channel and the bullish continuation could take it to the resistance levels of 3100 SAT and 3200 SAT.

In other words, if the bulls couldn’t regroup to halt the selling pressure and the coin dropped below the moving averages, XRP/BTC may follow the downward trend and the nearest support levels for the coin lies at 2600 SAT and 2500 SAT respectively. More so, the RSI (14) crosses above 60-level, which indicates more bullish signals.
Please note: Insidebitcoins.com is not a financial advisor. Do your research before investing your funds in any financial asset or presented product or event. We are not responsible for your investing results.
Join Our Telegram channel to stay up to date on breaking news coverage