Join Our Telegram channel to stay up to date on breaking news coverage
Bitcoin (BTC) Price Prediction – February 12
Bitcoin price approached $10,400 in a new bull-run that followed a recent dip to the support at $9,800. Meanwhile, the pullback was indeed necessary for the surge above $10,000.
BTC/USD Long-term Trend: Bullish (Daily Chart)
Key levels:
Resistance Levels: $11,000, $11,200, $11,400
Support Levels: $9,500, $9,300, $9,100
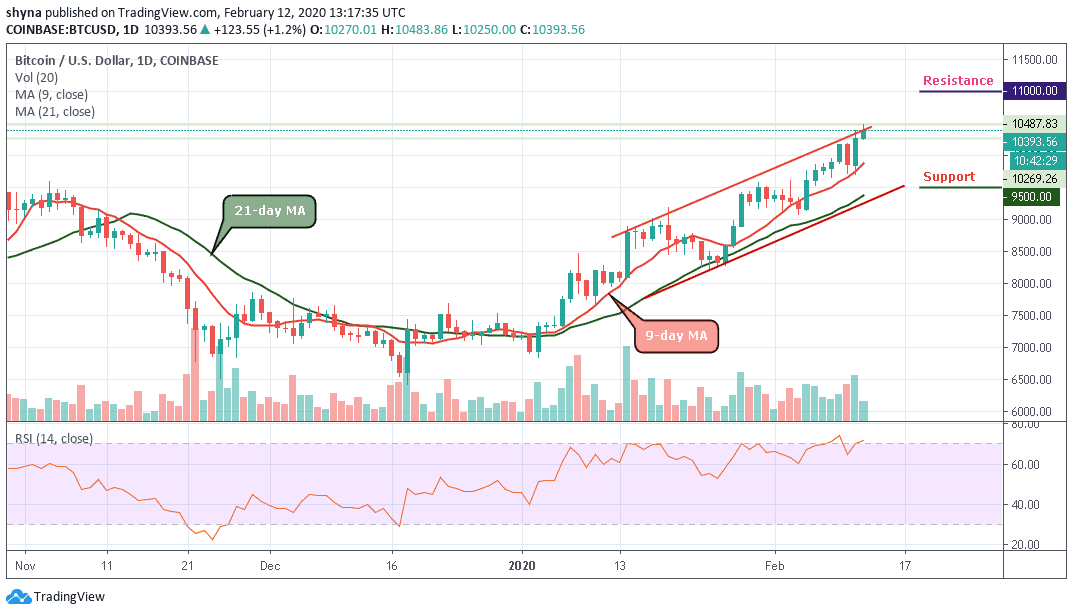
BTC/USD soars back in the old weekly trading price range as it joins the Bull rally again after two days of relaxation. With this BTC marks a fresh 2020 high above $10,400 in the past 24 hours and its likely to face major resistance at $10,500. BTC/USD is likely to face strong resistance at $10,800, followed by $11,000 and it is believed to consolidate and retest support at $10,000 and $9,800.
Currently, the market price for BTC/USD and the daily candle is trading at $10,393 but if the bulls could successfully push the price above the channel, the next resistance levels may be found at $11,000, $11,200 and $11,400. Typically when the new uptrends are beginning to form, traders will use both the 9-day and 21-day moving averages as the nearest support level.
However, any failure by the bulls to move the price up, we may see a price cut to $9,800 vital support. A further low drive could send the price to $9,500, $9,300 and $9,100 supports. For now, the bulls are still dominating the market. But as things stand, the BTC/USD price may continue to follow the upward trend because the RSI (14) is about to re-enter the overbought condition once more.
BTC/USD Medium – Term Trend: Bullish (4H Chart)
Looking at the 4-hour chart, the bears wanted to step back into the market by bringing the price from $10,486 to $10,254, but the bulls quickly held the support by picking the price from there to where it is currently trading at $10,389 which is above the 9-day moving average. Meanwhile, the $10,700 and above may come into play if BTC/USD breaks above the channel.
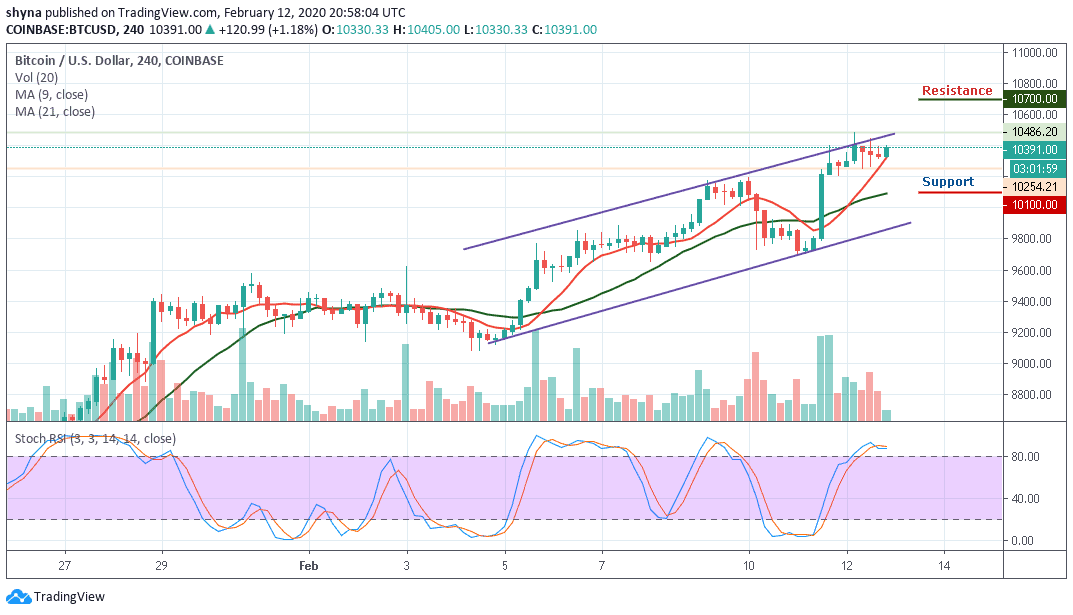
However, if the price breaks below the 9-day moving average of the ascending channel and begin to fall, the support levels of $10,100 and below may be in focus. Meanwhile, as the stochastic RSI moves within the overbought zone, more bullish signals may play out before a reversal could come in.
Please note: Insidebitcoins.com is not a financial advisor. Do your research before investing your funds in any financial asset or presented product or event. We are not responsible for your investing results.
Join Our Telegram channel to stay up to date on breaking news coverage