Join Our Telegram channel to stay up to date on breaking news coverage
XRP Price Analysis – July 4
XRP/USD has been on a downward move since April 29. Following the last breakdown on June 27, the downtrend has been temporarily suspended as bulls make positive moves. On the XRP/BTC, the coin is on a downward move. Presently, it is trading at Ƀ0.000019580 at the time of writing.
XRP/USD Market
Key Levels:
Resistance Levels: $0.24, $0.26, $0.28
Support Levels: $0.22, $0.20, $0.18
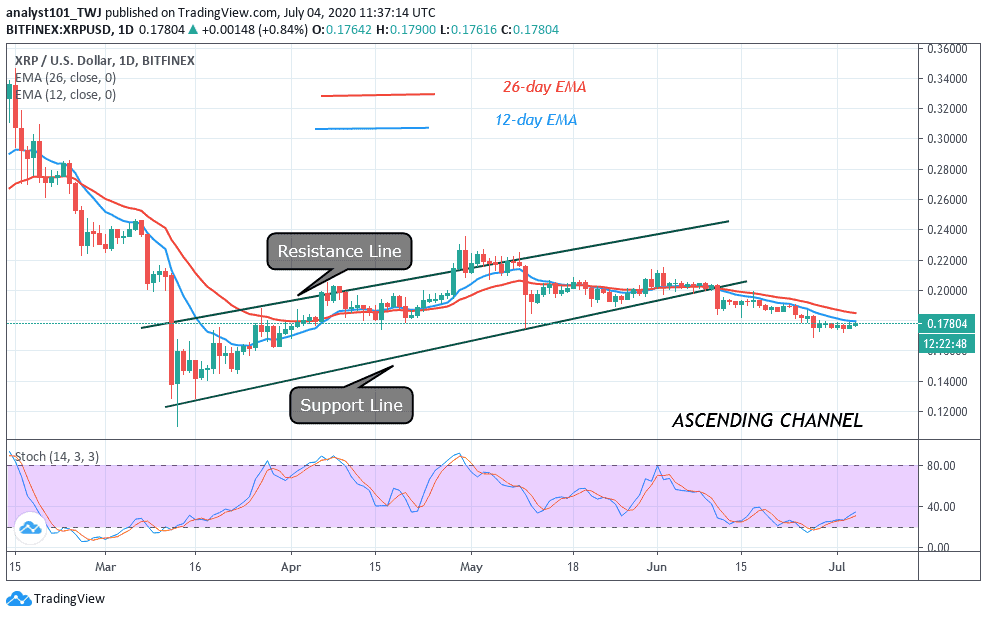
In the last couple of days, Ripple has made positive moves as price fell to the low of $0.17. XRP rebounded at the recent low and moved up immediately. For the past week, the bulls have sustained the uptrend but unable to break above the $0.18 resistance. In the meantime, the coin is trading below the resistance but trapped between $0.17 and $0.18. Ripple is one of the worst-performing altcoins as it has been on a downward move since April 29.
On the upside, if the bulls break above the $0.18 resistance, it may signal the end of the downtrend. Perhaps, the uptrend will resume as price rises to revisit the previous highs. However, if the bulls fail to break the current resistance, the bears will take advantage of the current support at $0.17. The market will decline to $0.14 or $0.12 low. The bulls are still sustaining the uptrend as XRP trades at $0.17741. Presently, Ripple is below 25% range of the daily stochastic. This explains that the market is in a bullish momentum.
Similarly, on the XRP/BTC chart, the market is in a downtrend. In June, the bulls have broken above the 12-day EMA and the 26-day EMAs but unable to sustain the upward move.

On two occasions, the bulls broke above the EMAs, but the selling pressure was overwhelming as the market fell to resume the downward move. Today, a Fibonacci tool is drawn to determine the extent of the downward move. A correction candle body tested 0.236 Fibonacci retracement level. It indicates that the coin will fall and reach a low of 4.236 extension level. In other words, XRP/BTC will reach a low of Ƀ0.000006913. However, the coin’s first target will be at level Ƀ0.00002000. Meanwhile; the pair is at level 41 of the Relative Strength Index. It indicates that the price is in the downtrend zone and it is below the centerline 50. The pair is likely to fall.
Join Our Telegram channel to stay up to date on breaking news coverage