Join Our Telegram channel to stay up to date on breaking news coverage
Bitcoin (BTC) Price Prediction – July 4, 2020
Following the last bearish impulse on July 2, BTC/USD slumped to $9,033 low. The bottom line is that Bitcoin risked a downward move if the $9,000- $9,200 support fails to hold. BTC is presently trading at $9,089 at the time of writing.
Key Levels:
Resistance Levels: $10,000, $11, 000, $12,000
Support Levels: $7,000, $6,000, $5,000
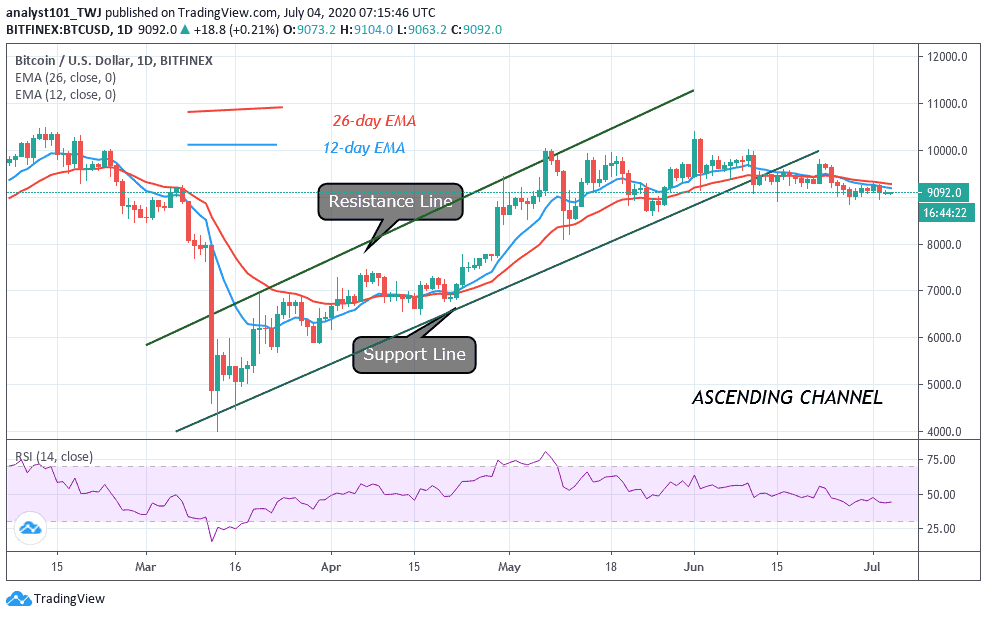
As Bitcoin reaches its critical support level, a breakdown or breakout is imminent. Assuming a breakdown occurs, it implies the bulls have failed to hold the $9,000- $9,200 support. At first, Bitcoin will fall to $8,825 support, if the bears break the $9,000 support. This is the previous resistance where buyers push the price above the $9,000 region for an upside range trading. Nevertheless, if the selling pressure persists, the coin will fall to $8,500 or $8,200 low. However, if this support level breaks, Bitcoin will drop to $8,130.
Meanwhile, at the time of writing Bitcoin is still trading in the lower region of $9,000. Perhaps, a breakout may suddenly occur as Bitcoin drops to $8,900. On the upside, a breakout will propel price to reach the $9,300 or $9,400 price level. This is the strongest support where Bitcoin resumes its upside range trading. In the upside range trading, BTC fluctuates between $9,300 and $9,800 to retest the $10,000 overhead resistance. The overhead resistance is yet to be broken since the resumption of sideways trading between $9,000 and $10,000. The king coin is at level 44 of the Relative Strength Index period 14. This implies that BTC is still in the bearish trend zone and it is likely to fall.
BTC/USD Medium-term Trend: Bullish (4-Hour Chart)
On the 4 hour chart, after Bitcoin dropped to $9,033 low, there was the appearance of a Doji candlestick. It indicates that the earlier trend is likely to reverse or it is losing strength.
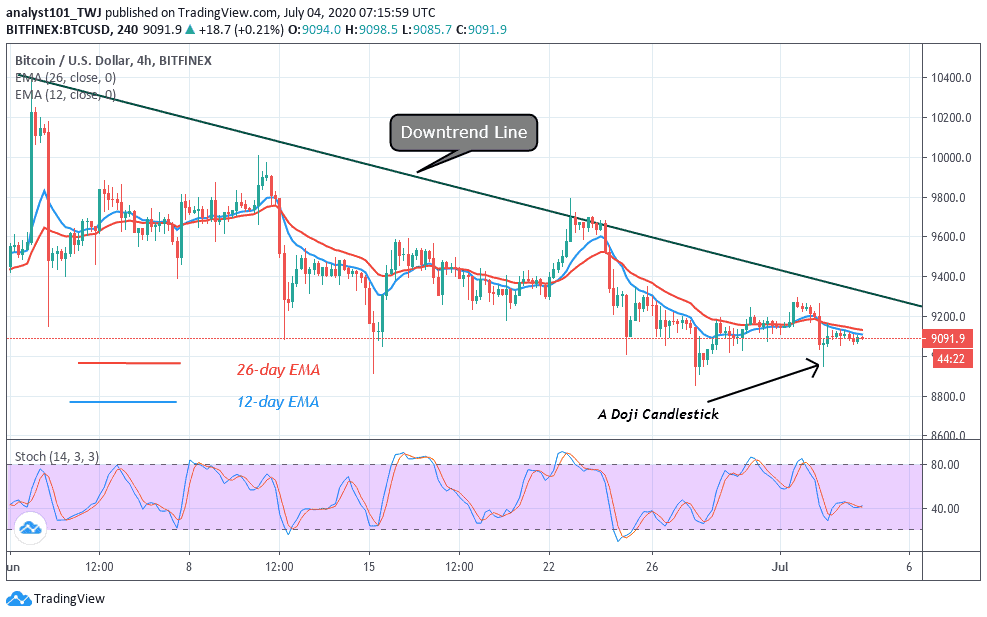
The critical support may hold if the bearish trend reverses. Meanwhile, the price bars are below the 12-day EMA and the 26-day EMA which indicates a further downward movement of the coin. The reverse will be the case if price is above the EMAs. The coin is presently above 40 % range of the daily stochastic. It indicates that the market is in a bullish momentum. The momentum is contrary to the price action.
Join Our Telegram channel to stay up to date on breaking news coverage