Join Our Telegram channel to stay up to date on breaking news coverage
XRP Price Prediction – January 17
XRP/USD is making an attempt to keep its upward movement as the buyers struggle to move the coin into a new height.
XRP/USD Market
Key Levels:
Resistance levels: $0.25, $0.27, $0.29
Support levels: $0.21, $0.19, $0.17
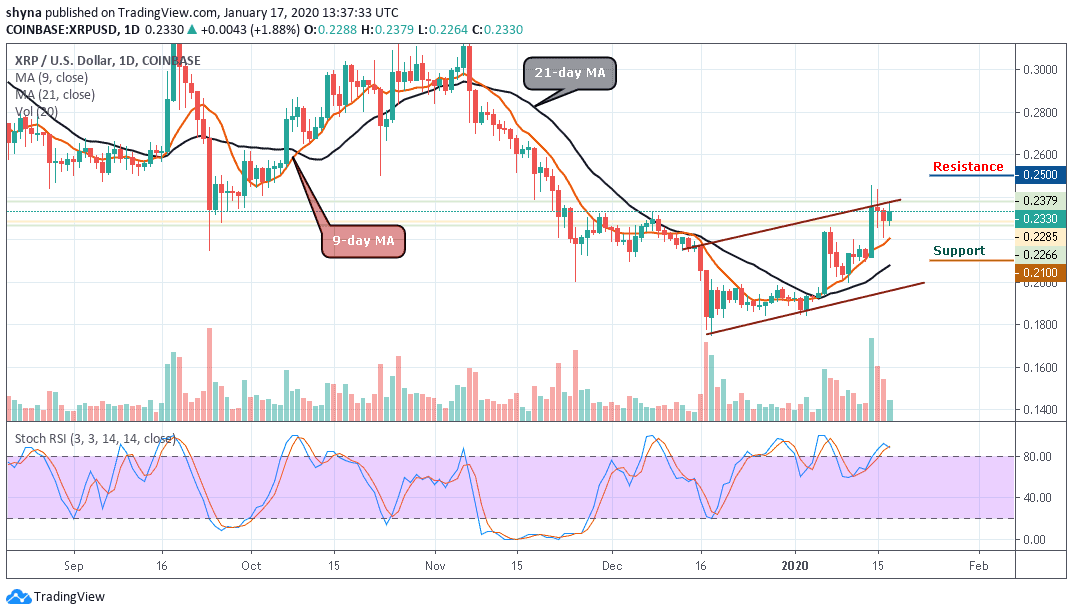
XRP/USD has been increasing slowly since a couple of days ago, earning around 1.88% during the negotiation today. Looking at the daily chart, Ripple (XRP) has been rising and falling since January 10 after a bullish rally. The bulls strongly control the market with a current movement near the upper boundary of the ascending channel and above the 9-day and 21-day moving averages.
In addition, Ripple (XRP) remains the third-largest cryptocurrency with a market cap of $10.26 billion. The Ripple price has seen a slight increase in the market over the past 24 hours and it is currently trading around $0.230. For now, XRP/USD has been back on the rise since the start of January as it managed to surge above the moving averages.
Moreover, if the price breaks out of the ascending channel, the resistance levels of $0.25, $0.27 and $0.29 could be visited. Meanwhile, on the downside, the market can be supported at levels of $0.21 and $0.19 and if the price falls below the previous levels, another support is around $0.17. The stochastic RSI has already climbed into the overbought zone and this crossover has confirmed a robust bullish move for the market.
When compared with BTC, the coin is consolidating within the descending channel and still trading around the 9-day and 21-day moving averages at 2642 SAT. Meanwhile, the bulls are making effort to push the price above the moving averages, should in case they succeed, the bullish continuation could take the price to the resistance levels of 2800 SAT and 2900 SAT respectively.
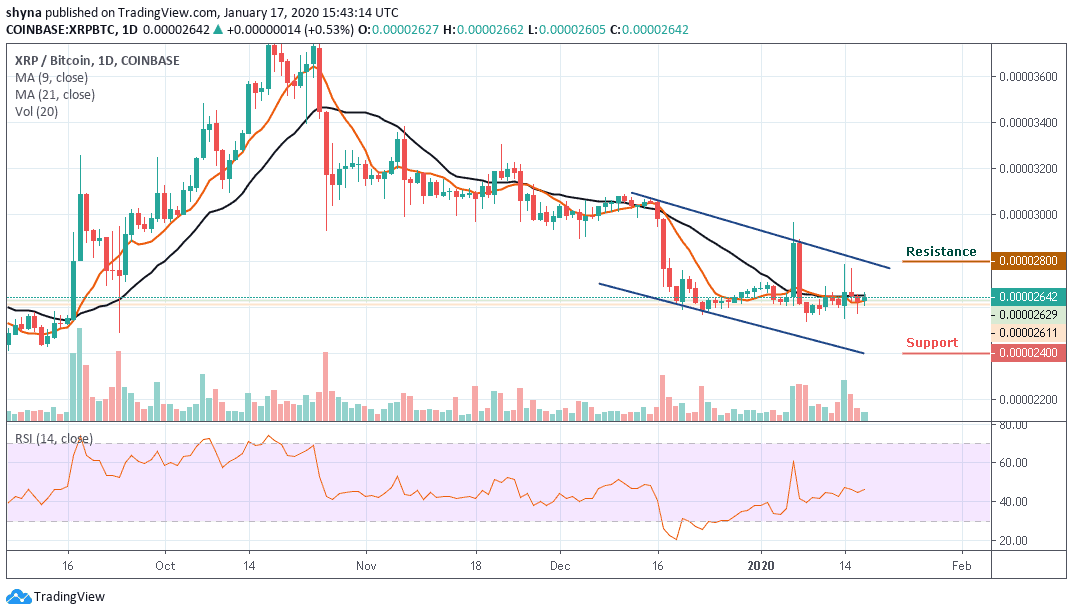
Furthermore, looking at the daily chart, if the bulls failed to hold the price, the coin may likely fall below the moving averages and further dropping could bring it to the lower boundary of the channel and meet the nearest support levels of 2400 SAT and 2300 SAT. The RSI (14) moves in the direction, suggesting a sideways movement.
Please note: Insidebitcoins.com is not a financial advisor. Do your research before investing your funds in any financial asset or presented product or event. We are not responsible for your investing results.
Join Our Telegram channel to stay up to date on breaking news coverage