Join Our Telegram channel to stay up to date on breaking news coverage
XRP Price Prediction – January 31
Ripple (XRP) is making an attempt to keep its upward movement as the bulls fail to move the cryptocurrency to a new height.
XRP/USD Market
Key Levels:
Resistance levels: $0.270, $0.280, $0.290
Support levels: $0.210, $0.200, $0.190

XRP/USD is one of the cryptocurrencies that is pushing for the end of the month’s recovery. The Asian session is characterized by a loss of 2.42% on the day. XRP/USD is trading at $0.237, although it opened today’s session at $0.243, the bulls are intentional in their muscle-flexing. For instance, a break above the channel on the daily chart means that XRP bulls may continue to move up.
However, XRP/USD is on the verge of maintaining an upward trend, hoping to break above the upper boundary of the channel. So far so good, as the market opens today, the coin has gone up slightly from $0.243 to $0.245. Currently, the price is negotiating with resistance above the 9-day moving average. The stochastic RSI indicator shows increasing bullish momentum.
More so, a significant cross above the channel could sustain the bulls to $0.250 and $0.260 highs. Although, Ripple is currently facing an upward trend and still maintaining it. If XRP manages to surge above $0.260, it may see resistance at $0.270, $0.280 and $0.290. In other words, a further drop may bring it to the support levels of $0.210, $0.200 and $0.190 respectively.
When compared with Bitcoin, XRP is still trading on the downside, although the price action has remained intact within the descending channel. If the selling pressure persists, the XRP price variation may likely close the month a new low. At the moment, the RSI (14) has decided to be moving in the same direction within 40-level; we may see a negative move in the market soon as the 9-day (orange-line) MA has crossed below the 21-day (black-line) MA.
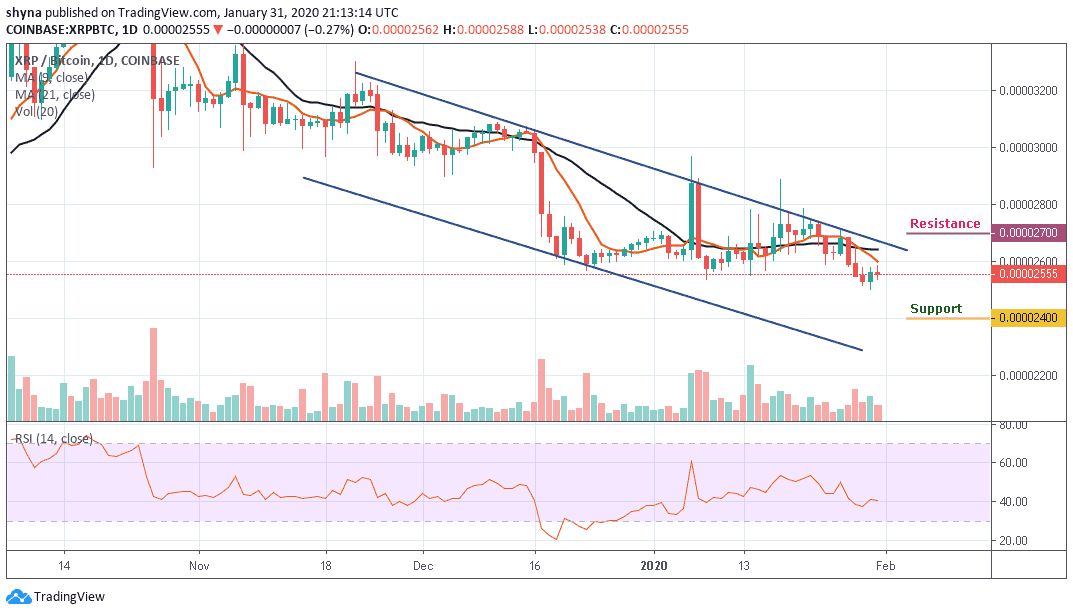
However, the coin is currently trading below the 9-day and 21-day moving averages at 2555 SAT. We may expect close support at the 2500 SAT before breaking to 2400 SAT and critically 2400 SAT levels. If a bullish movement occurs and validates a break above the upper boundary of the channel; we can then confirm a bull-run for the market and the nearest resistance levels lie at 2700 SAT and above.
Please note: Insidebitcoins.com is not a financial advisor. Do your research before investing your funds in any financial asset or presented product or event. We are not responsible for your investing results.
Join Our Telegram channel to stay up to date on breaking news coverage