


Join Our Telegram channel to stay up to date on breaking news coverage
XRP Price Prediction – January 22
The Ripple price action is moving within a range of block formation via the daily chart view.
XRP/USD Market
Key Levels:
Resistance levels: $0.260, $0.270, $0.280
Support levels: $0.200, $0.190, $0.180

Today, XRP/USD is trading in the minor negative territory, nursing losses of 0.68%. However, given the large narrowing in price action, a breakout could very well be explosive for the coin as the price moves within an ascending wedge structure, subject to a breach. The Ripple’s price is changing hands above the 9-day and 21-day moving averages within a range high up at $0.243 down to a low of $0.227.
Moreover, the resistance at $0.240 on the daily chart is giving the bulls a hard time and so, the correction above the key $0.240 hurdle might take longer. Otherwise, if not overcome, the bulls are likely to get discouraged, losing balance and allowing for losses towards $0.220. Meanwhile, from a broader technical perspective, Ripple is still in the January nurtured uptrend.
Furthermore, the rising channel support continues to be critical to the trend. The traders should expect a bounce-back towards the north if the support is tested again. On the flip side, the channel resistance must come down for XRP to move majestically in the direction of $0.260, $0.270 and $0.280 resistance levels. More so, as the stochastic RSI faces the south, the support levels of $0.200, $0.190 and $0.180 may come into focus.
When compared with Bitcoin, the Ripple market price is ranging and trading within the channel since December 19. For now, the coin is trading at 2721 SAT above the 9-day and 21-day moving averages. Looking at the daily chart, the market may likely experience a bullish trend as the stochastic RSI is about entering into the overbought zone.
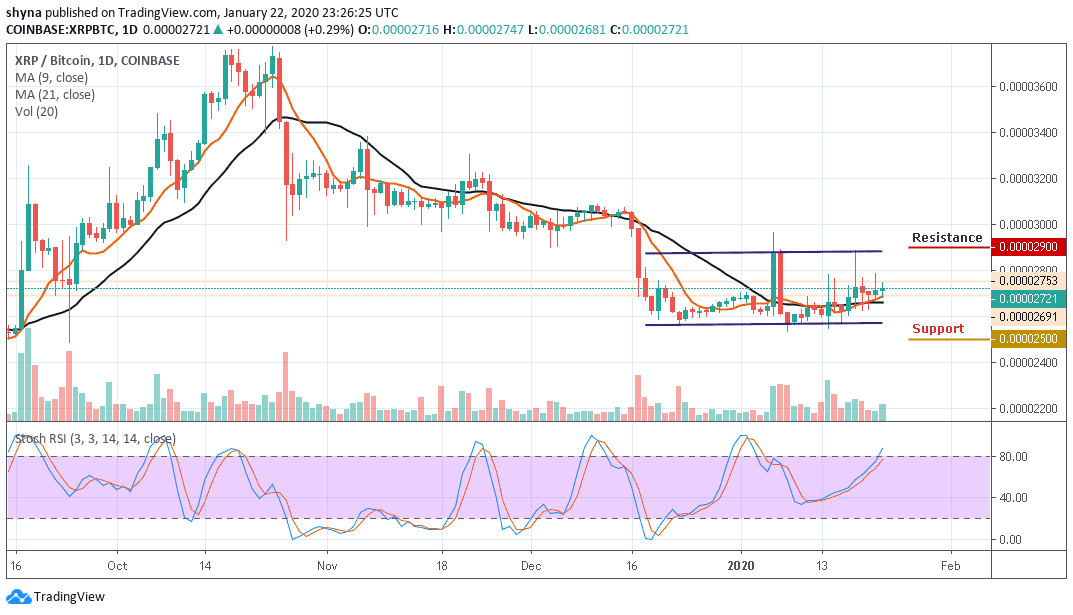
In other words, should the market decide to fall below the moving averages, the next key supports could be 2500 SAT and below. Meanwhile, on the bullish side, a possible rise could take the market towards the resistance level of 2900 SAT and 3000 SAT.
Please note: Insidebitcoins.com is not a financial advisor. Do your research before investing your funds in any financial asset or presented product or event. We are not responsible for your investing results.
Join Our Telegram channel to stay up to date on breaking news coverage
