Join Our Telegram channel to stay up to date on breaking news coverage
XRP Price Prediction – March 16
The Ripple (XRP) has touched the support of $0.127 while traders have turned bearish for the time being, predicting that another price drop is possible.
XRP/USD Market
Key Levels:
Resistance levels: $0.190, $0.210, $0.230
Support levels: $0.100, $0.008, $0.006
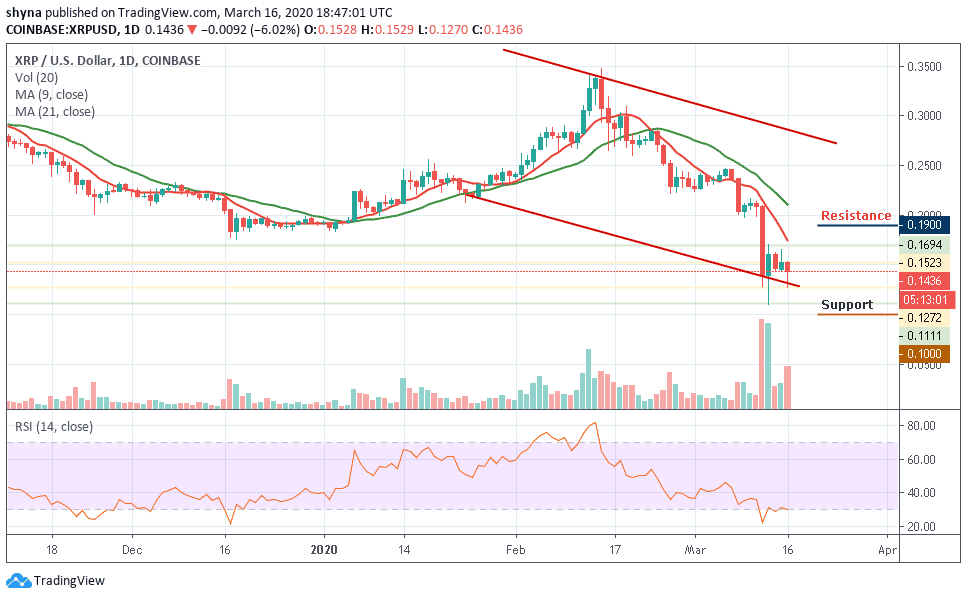
Following the massive altcoins drop that started last week which brought BTC down from $8,022 to the $4,700 area very quickly, XRP/USD also dropped from $0.208 to $0.128. The rising pattern has seen a bearish breakout recently; yesterday’s pullback following the sharp spike above $0.160 with the upside momentum that made the Ripple’s outlook to be relieving bullish but more the price to go below $0.150 today.
However, XRP/USD is currently facing rapid fluctuations in its price with a negative approach at the time of writing. Meanwhile, XRP price has traded way below $0.150, again triggering a selling pressure. The pair has recently breached a rising pattern that was formed yesterday as the coin traced higher highs and shot up even above $0.165. The Ripple (XRP) later pulled back strongly before closing yesterday of which the bears haven’t stopped there.
Moreover, the price of the coin is changing hands at $0.143 level and the bears are still following the downtrend. If the price moves below the lower boundary of the channel, the coin may visit the support level of $0.100, $0.008 and $0.006. Moreover, the RSI (14) moves in sideways above the oversold condition. Any movement towards the north could bring a positive result by taking the market above the 9-day MA which may hit the nearest resistance levels of $0.190, $0.210 and $0.230 respectively.
Checking it against BTC, XRP is still consolidating within the channel, moving above the 9-day and 21-day moving averages. Meanwhile, should in case the bulls maintain the movement towards the north, the coin may cross above the channel and the bullish continuation could take it to the resistance levels of 3100 SAT and 3200 SAT.
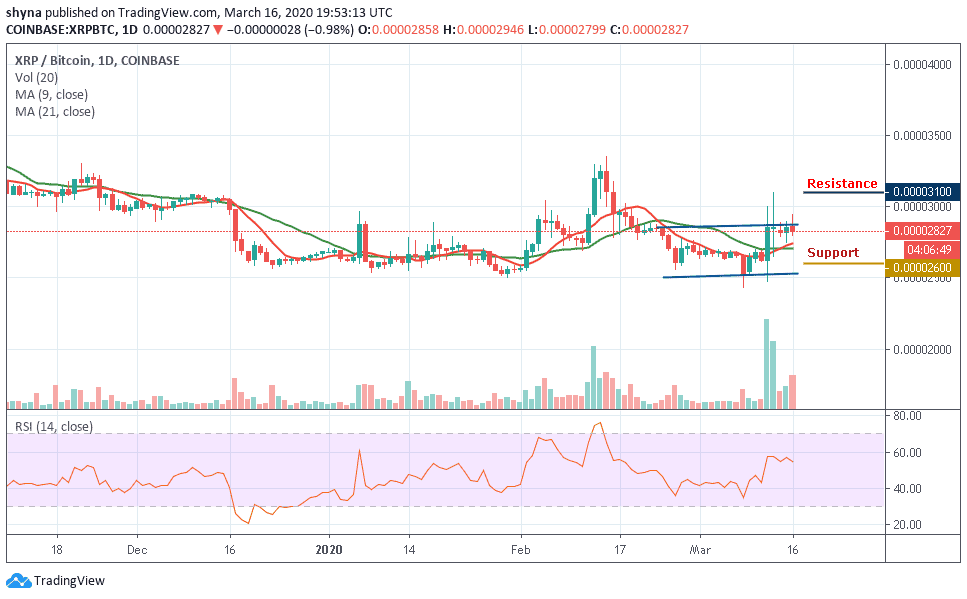
In other words, if the bulls couldn’t regroup to halt the selling pressure and the coin dropped below the moving averages, XRP/BTC may follow the downward trend and the nearest support levels for the coin lies at 2600 SAT and 2500 SAT respectively. More so, the RSI (14) is moving below 60-level, which indicates sideways movement for the coin.
Please note: Insidebitcoins.com is not a financial advisor. Do your research before investing your funds in any financial asset or presented product or event. We are not responsible for your investing results.
Join Our Telegram channel to stay up to date on breaking news coverage