Join Our Telegram channel to stay up to date on breaking news coverage
XRP Price Prediction – February 21
Today, the Ripple (XRP) price is trading in positive territory, with gains of some 1.77%.
XRP/USD Market
Key Levels:
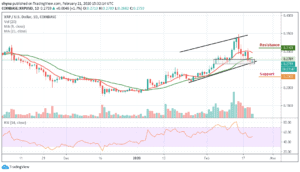
Resistance levels: $0.31, $0.32, $0.33
Support levels: $0.23, $0.22, $0.21
XRP/USD is trying to rebound or see a slight respite from the downward pressure. The coin continues to move very tightly on a long-term uptrend support line. The bulls canceled out yesterday’s bearish action as the price settled around the $0.275 level. The RSI (14) indicator is trending around the neutral zone as the bulls and bears cancel each other out.
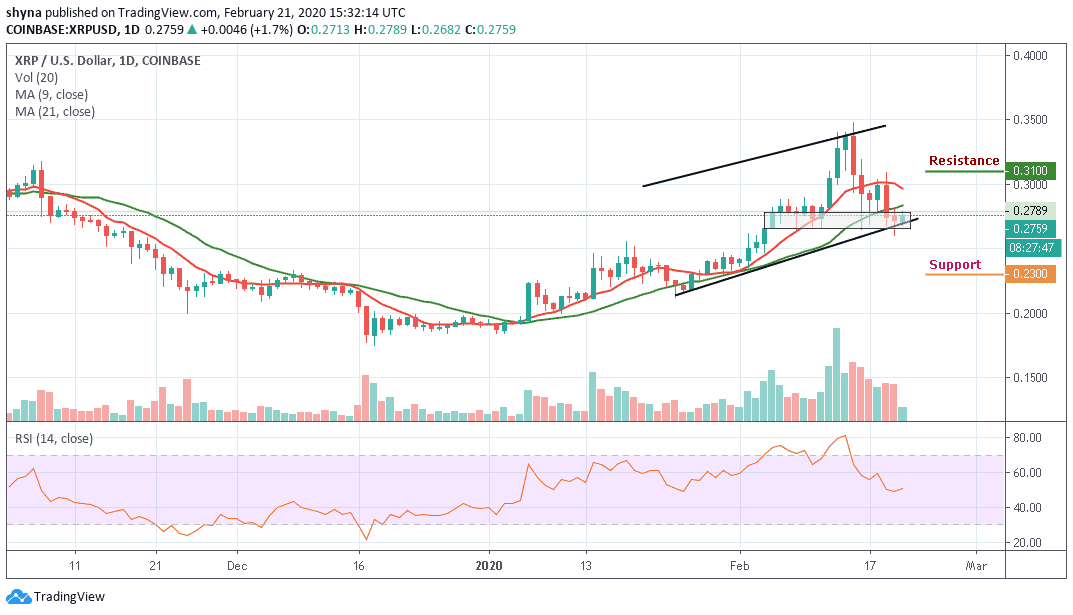
As the daily chart revealed, XRP/USD continues to move at the lower boundary of the ascending channel at $0.275. Nevertheless, the pair also continues to remain strongly supported at $0.260 and would need to fall beneath this to head lower. More so, the Ripple (XRP) must break above the resistance at $0.30 to continue its bullish drive higher. However, if it falls beneath $0.26, the market would turn neutral, and a drop beneath the lower boundary of the channel would turn it bearish.
However, A bearish continuation could then bring the market to the critical supports at $0.023, $0.22 and $0.21 respectively. On the contrary, should the bulls continue with the upward movement, the price may likely move above the 9-day and 21-day moving averages to hit the potential resistance levels at $0.31, $0.32 and $0.33.
Against BTC, XRP is consolidating within the channel as the price moves below the 9-day and 21-day moving averages. Meanwhile, the buyers are trying to push the price back above the moving average and the bullish continuation may take it to the resistance levels of 3100 SAT and 3200 SAT respectively.
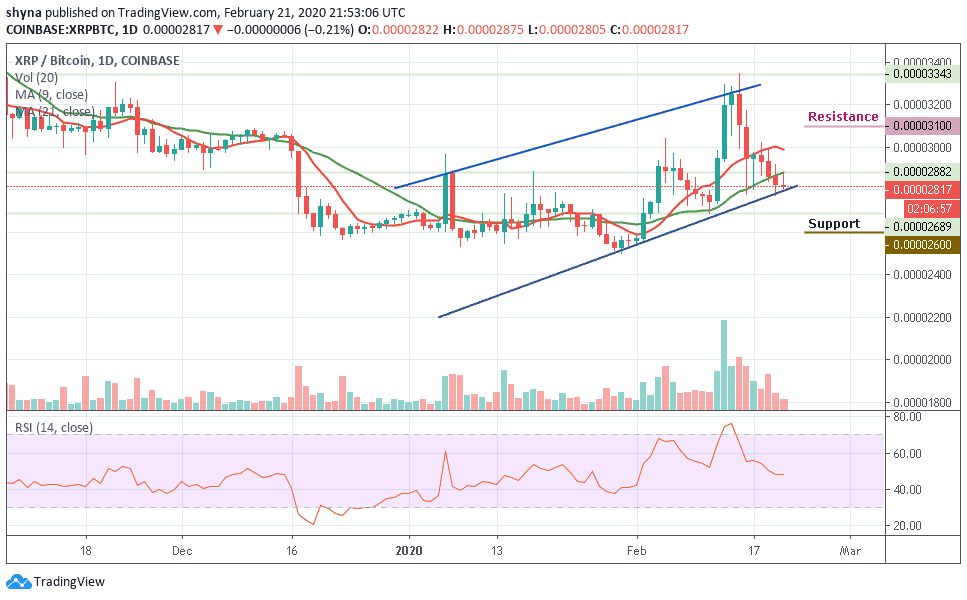
However, if the bulls failed to hold the price tight by pushing it upward, then it may likely fall below the lower boundary of the channel. The nearest support levels lie at 2600 SAT and 2500 SAT while the RSI (14) moves around 48-level, which may likely give more bearish signals.
Please note: Insidebitcoins.com is not a financial advisor. Do your research before investing your funds in any financial asset or presented product or event. We are not responsible for your investing results.
Join Our Telegram channel to stay up to date on breaking news coverage