Join Our Telegram channel to stay up to date on breaking news coverage
Ripple Price Prediction – June 2
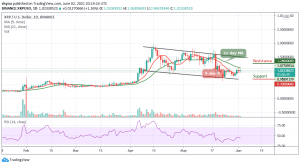
For the past few days, the Ripple price has been unable to develop bullish momentum above the $1.20 resistance level.
XRP/USD Market
Key Levels:
Resistance levels: $1.28, $1.38, $1.48
Support levels: $0.70, $0.60, $0.50
XRP/USD is bullish as the market retraced to $0.96 support and currently prepares to move higher again. Therefore, we expect the Ripple price to move higher later today and push towards the $1.20 level.
Although XRP/USD opened yesterday at $1.01 after a bearish closing price, since then the market has moved sideways as the bulls prepare to push higher. Therefore, we expect XRP/USD to rise to the next target at $1.20 in the next 24 hours.
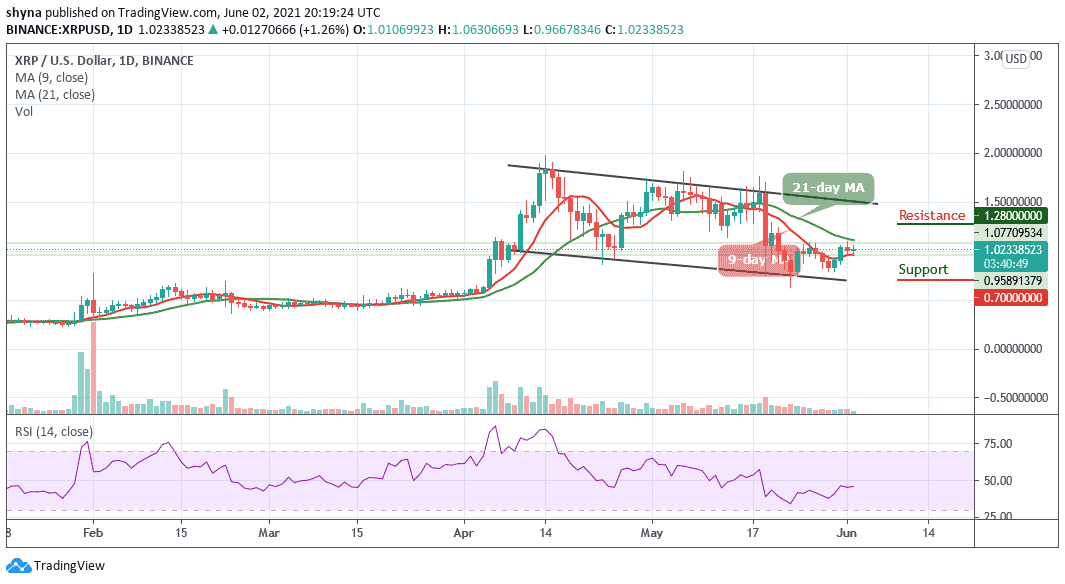
Ripple Price Prediction: Next Direction for XRP?
If the bulls manage to keep the Ripple price above the 21-day moving average; they may likely find the resistance levels of $1.28, $1.38, and $1.48.
Meanwhile, if the market begins to experience bearish movement, it will likely hit the nearest support below the 9-day and 21-day moving averages and a further drop could pull the market to $0.70, $0.60, and $0.50 supports. Also, the technical indicator Relative Strength Index (14) is slowly moving below the 50-level, suggesting sideways movement.
When compared with Bitcoin, Ripple’s price is still pointing lower based on the technical indicator, although price movement around the 9-day and 21-day moving averages has remained intact. Therefore, if the selling pressure continues, the Ripple price volatility is likely to create a new low in the coming trading days.
At this time, the technical indicator Relative Strength Index (14) is hovering above the 50-level. Traders could continue to see negative market movement in the near term if the signal line crosses below the 50-level, and can also expect close support at 2550 SAT if the market price dips below the lower boundary of the channel to reach critical support at 2200 SAT and below.
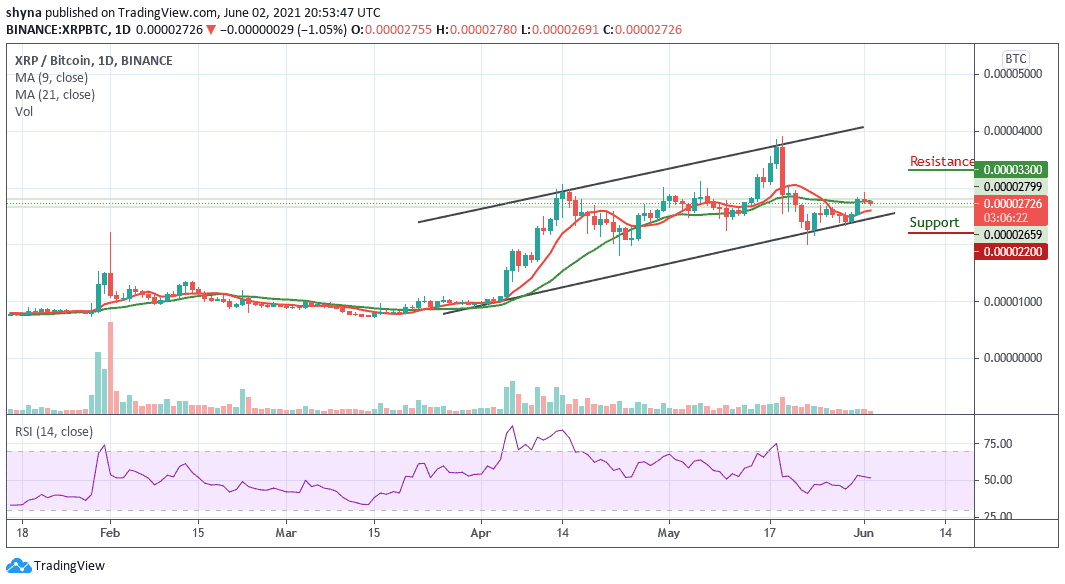
However, when an upward movement occurs and confirms a breakout well above the 9-day and 21-day moving averages, traders can confirm a bull run for the market, and the next resistance levels are located at 3300 SAT and above.
Looking to buy or trade Ripple (XRP) now? Invest at eToro!
75% of retail investor accounts lose money when trading CFDs with this provider
Join Our Telegram channel to stay up to date on breaking news coverage