Join Our Telegram channel to stay up to date on breaking news coverage
Ripple Price Prediction – May 30
Over the past 24 hours, Ripple (XRP) has gained almost 8% and the next resistance level could be at $1.00.
XRP/USD Market
Key Levels:
Resistance levels: $1.15, $1.25, $1.35
Support levels: $0.55, $0.45, $0.35
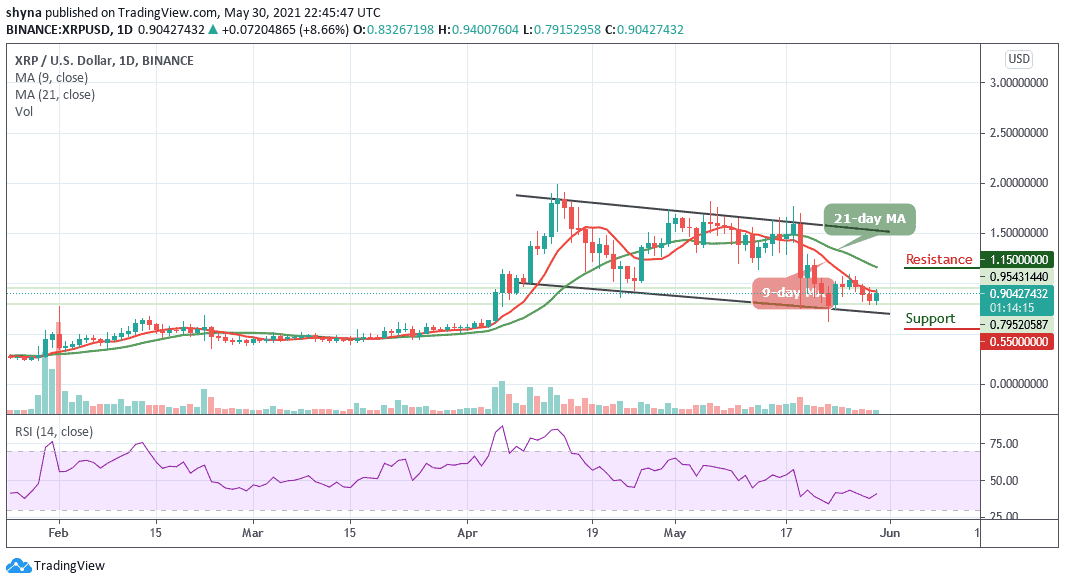
XRP/USD is seen moving from $0.83 to the area above $0.90 in a matter of hours and has touched an intraday high at $0.94. While the coin is seen retreating below this level, the pair retains bearish momentum.
Moreover, the Ripple price is currently trading at $0.90 in a daily downtrend which may most likely form a bear flag in the long term. In the short term, XRP/USD has gained more than 8.66% in the last 24 hours.
Ripple Price Prediction: What is the Next Direction for Ripple?
Due to a strong upside movement of the coin, the Ripple price looks into an uptrend as it readies to trade above the 9-day moving average. Yesterday’s low at $0.79 may now serve as strong support for the coin. Therefore, if it is broken, the sell-off may be extended to $0.60.
Currently, the bulls are planning to come into focus by pushing the Ripple price above the 9-day MA. However, if the price moves below this barrier, it could hit the support levels of $0.55, $0.45, and $0.35.
As the daily chart reveals, the Relative Strength Index (14) is moving towards 40-level, which indicates that the bullish trend may likely play out. Meanwhile, if the bulls can put more effort and push the Ripple price higher, further resistance could be found at $1.15, 1.25, and $1.35.
When compared with Bitcoin, the Ripple (XRP) is demonstrating positivity above the 9-day moving average. However, the trend is ranging in the short-term and moves within the channel. It is currently changing hands at 2531 SAT but the coin is still very close to the lower boundary of the channel.
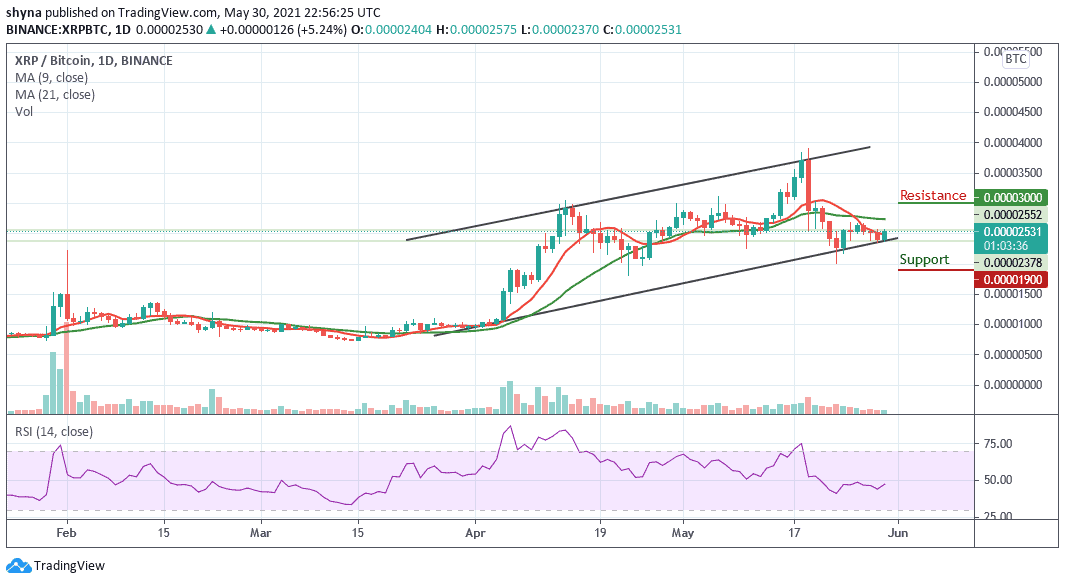
Moreover, the resistance levels to look for are 3000 SAT and 3200 SAT while the closest support levels to keep watching are 1900 SAT and 1700 SAT. Therefore, the technical indicator Relative Strength Index (14) is planning to cross above the 50-level, indicating more bullish signals.
Looking to buy or trade Ripple (XRP) now? Invest at eToro!
75% of retail investor accounts lose money when trading CFDs with this provider
Join Our Telegram channel to stay up to date on breaking news coverage