Join Our Telegram channel to stay up to date on breaking news coverage
XRP Price Prediction – May 22
Within 24 hours, Ripple (XRP) is gaining more than 3.96% and the next resistance level may be at $0.22.
XRP/USD Market
Key Levels:
Resistance levels: $0.23, $0.24, $0.25
Support levels: $0.16, $0.15, $0.14

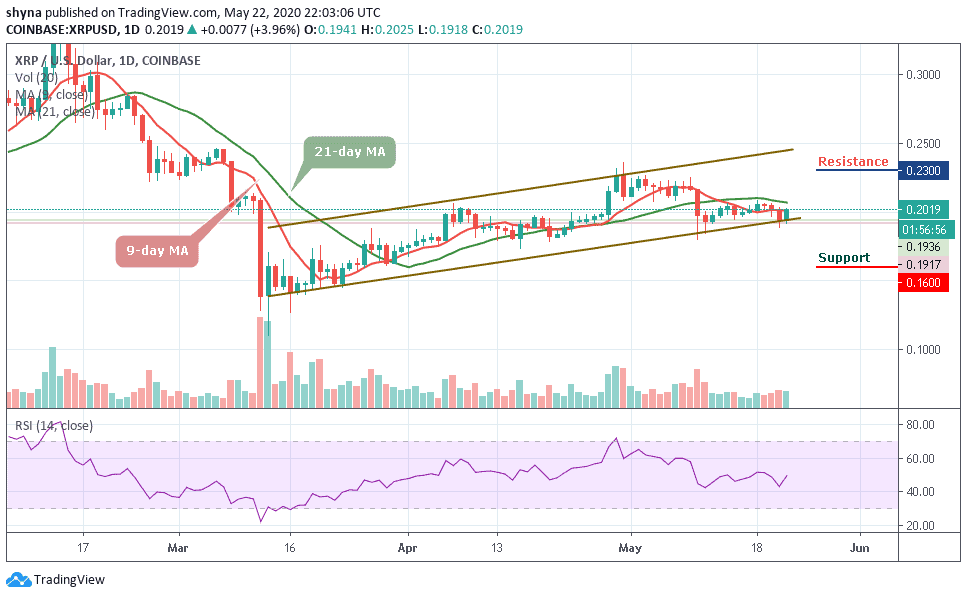
XRP/USD moves from $0.191 to the area above $0.200 in a matter of hours and touched an intraday high at $0.202. While the coin has retreated to $0.201 at the time of writing, the pair retains bullish momentum. In the short term, XRP/USD has gained more than 3.96% in the last 24 hours. Therefore, a sustainable move above $0.200 might improve the technical picture, provided that we see a follow through and recovery towards $0.203.
Currently, the price of the coin is changing hands at $0.201 level and the bulls are still gathering momentum. If the price moves below the lower boundary of the channel, the price could be pushed to the support level of $0.16, $0.15 and $0.14 levels. Meanwhile, in as much as the green-line of the 21-day moving average is still above the red-line of the 9-day moving average, the Ripple price may continue to be on the bears’ side.
Moreover, the technical indicator RSI (14) is making an attempt to cross above the 50-level, if this possible, then the bullish trend may come to play. More so, should the bulls put more effort to push the XRP/USD higher, further resistance may likely be found at $0.23, $0.24, and $0.25 levels before the market is free to make another attempt at $0.26 level.
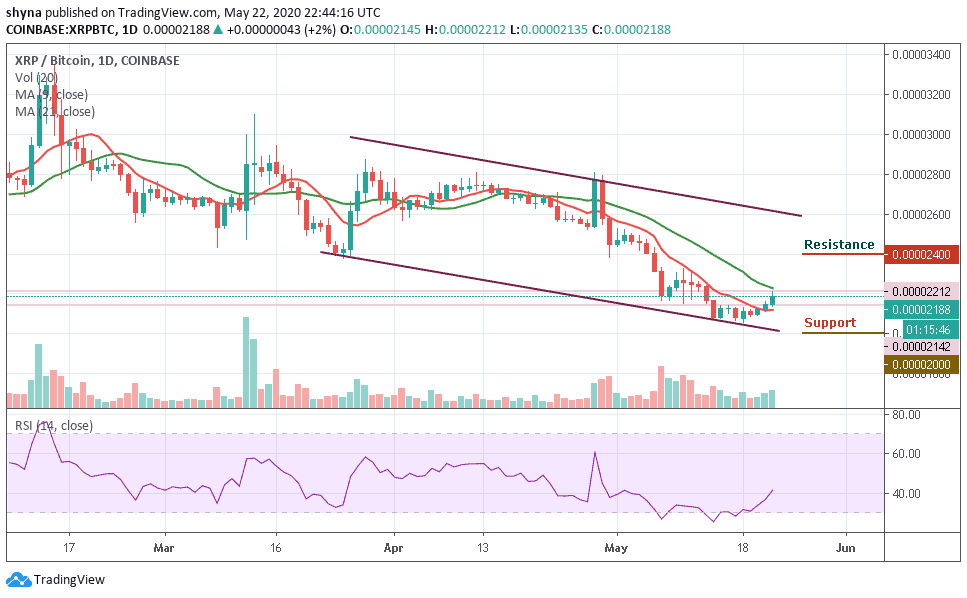
Against Bitcoin, Ripple (XRP) is still demonstrating some positive signs across the market. The trend is perpetually looking bullish in the long-term and moving within the descending channel. It is currently changing hands at 2188 SAT after witnessing some bearish moment last few weeks.

More so, the resistance levels to look for are 2400 SAT and 2600 SAT while the closest support levels to keep an eye on are 2000 SAT, 1800 SAT, and critically 1600 SAT. The RSI (14) is moving above 40-level, which indicates more bullish signals for some time.
Please note: Insidebitcoins.com is not a financial advisor. Do your research before investing your funds in any financial asset or presented product or event. We are not responsible for your investing results.
Read more:
- Cosmos Price Prediction for Today, October 25: ATOM Awaiting a Breakup at $11 Level
- Ethereum Price Prediction: ETH/USD Bulls Reclaim $1700 Resistance Level; More Hurdles to Cover
Join Our Telegram channel to stay up to date on breaking news coverage

