Join Our Telegram channel to stay up to date on breaking news coverage
Bitcoin (BTC) Price Prediction – May 22
The Bitcoin price is hovering above $9,000 but the upside momentum is still slow.
BTC/USD Long-term Trend: Bullish (Daily Chart)
Key levels:
Resistance Levels: $10,400, $10,600, $10,800
Support Levels: $8,000, $7,800, $7,600
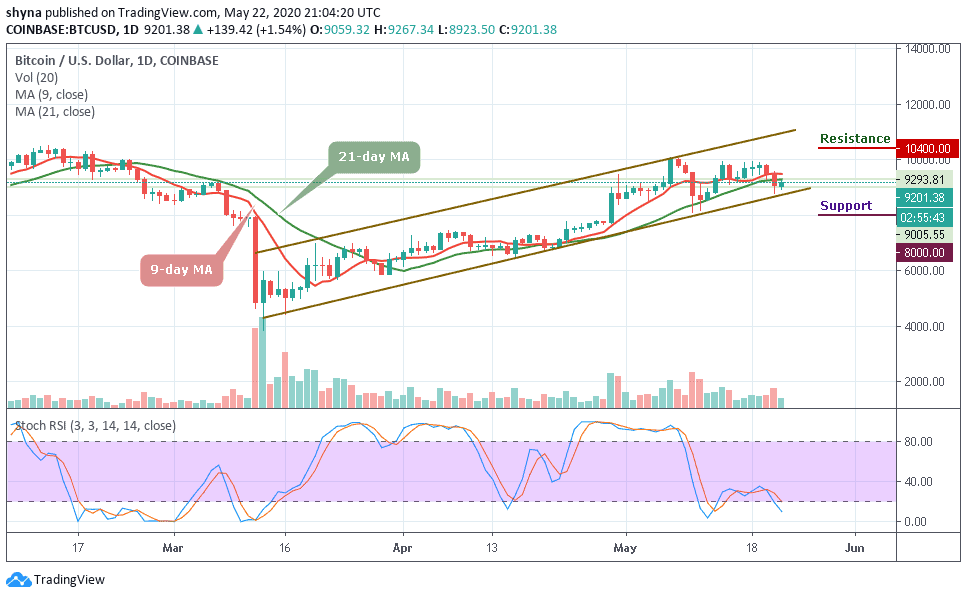
BTC/USD has seen recovery above $9,000 to trade at $9,201 at the time of writing. The first digital coin experienced a massive sell-off below $9,000 yesterday and hit the recent low at $8,789 where new buyers popped in and saved the game. More so, with the on-going recovery, BTC/USD is up with the gain of 1.54% on a day-to-day basis and making an attempt to trade above the 9-day and 21-day moving averages.
However, on the upside, a recovery above $9,200 will improve the short-term technical picture and allow for an extended upside move towards $9,700 and $9,900, which includes yesterday’s high and the above-mentioned congestion area. Looking at the daily chart, BTC/USD remains slightly in the hands of the bulls and if boosted, they could increase their positions and pull Bitcoin farther up.
In addition, as the stochastic RSI moves into the oversold zone if the market decides to fall, the price of Bitcoin could fall below the lower boundary of the channel around $8,500, and if that support fails to hold the sell-off, traders could see a further decline at $8,000, $7,800 and critically $7,600. All the same, the resistance levels to watch are $10,400, $10,600, and $10,800 respectively.
BTC/USD Medium-Term Trend: Bullish (4H Chart)
Looking at the 4-hour chart, BTC/USD needs to climb $9,400 above the moving averages within the channel to mitigate the short-term bearish pressure and allow for an extended recovery towards $9,500. This psychological barrier may closely follow by $9,600 and $9,800 resistance levels.
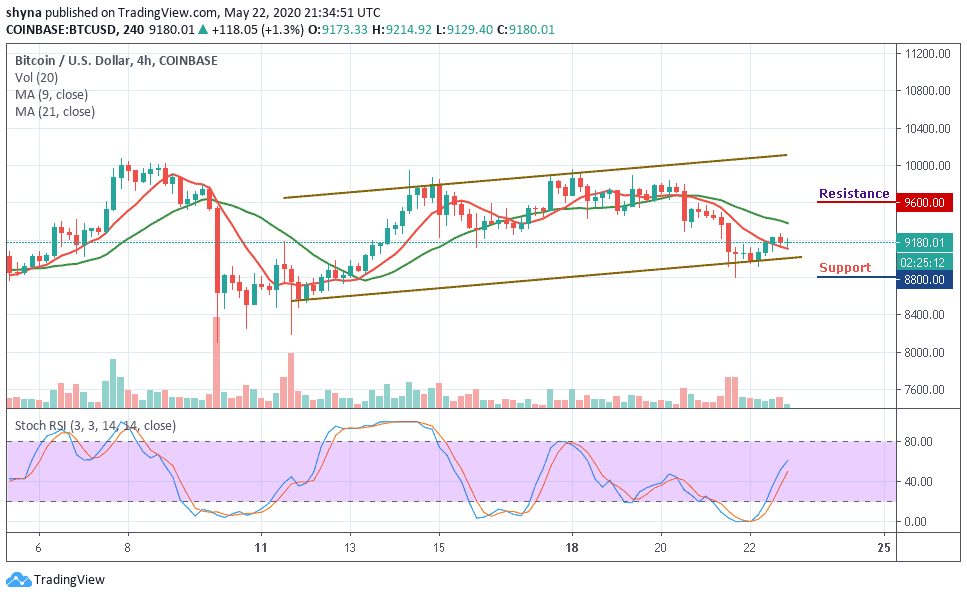
In contrast, the nearest support below the channel and a sustainable move lower will increase the downside pressure and push the price towards $8,800 and $8,600 support levels. Considering that the stochastic RSI on a 4-hour chart is moving above the 45-level, traders might expect more bullish signals into the market.
Please note: Insidebitcoins.com is not a financial advisor. Do your research before investing your funds in any financial asset or presented product or event. We are not responsible for your investing results.
Join Our Telegram channel to stay up to date on breaking news coverage