Join Our Telegram channel to stay up to date on breaking news coverage
XRP Price Prediction – August 18
The technical indicator is creeping within the overbought zone as XRP/USD bulls aim to take price above the $0.32 level.
XRP/USD Market
Key Levels:
Resistance levels: $0.35, $0.37, $0.39
Support levels: $0.28, $0.26, $0.24
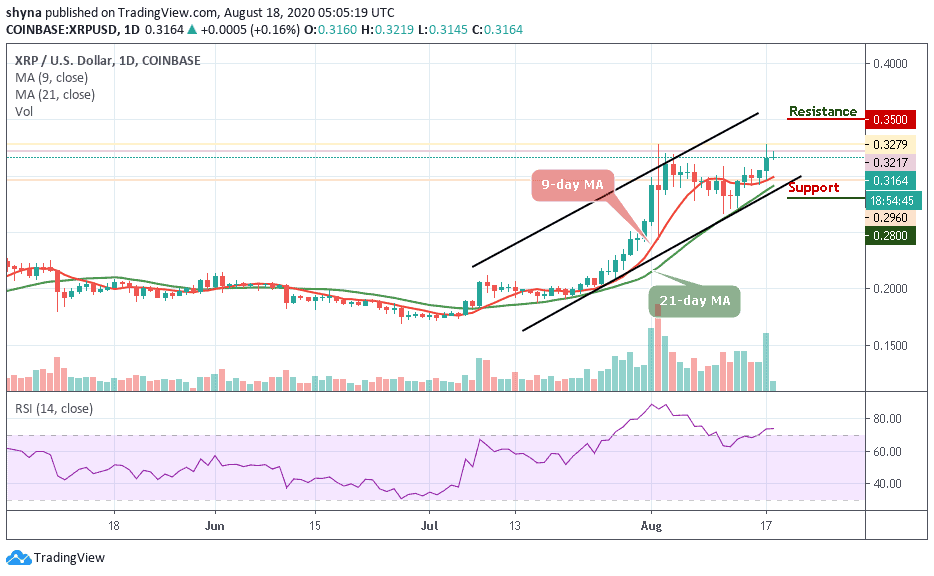
According to the daily chart, XRP/USD is most likely to settle for consolidation in the near term. The technical indicator RSI (14) is seen moving sideways within the overbought region after the coin touched $0.327 yesterday. Meanwhile, if this technical indicator holds onto the sideways movement, buyers may have an opportunity to keep the price above $0.32 and reenergize for another run-up to $0.34.
What is Next for Ripple (XRP)?
For XRP/USD, the hope for gains above $0.32 is not yet lost, at least for now, the market price remains within the overbought zone. On the bright side, this shows that buyers are still controlling the market and this time, the market price likely stay within this region for some time before heading to the south. If the coin decides to follow the downward movement, crossing below the lower boundary of the channel may meet the supports at $0.28, $0.26, and $0.24 respectively.
However, XRP/USD bulls have been maintaining the upward movement and the market price has gone up to $0.321 in the early hours of today before retreating to where it is trading currently at $0.316. More bullish action is expected if Ripple managed to clear the resistance level of $0.33. This may cause the price to reach the potential resistance levels of $0.35, $0.37, and $0.39.
Against Bitcoin, XRP is consolidating within the channel and trading above the 9-day and 21-day moving averages at 2578 SAT. Meanwhile, the bulls are making an effort to push the price above 2700 SAT as the RSI (14) moves around 60-level. If this is possible, the bullish continuation could take the price to the resistance levels of 2900 SAT and 3000 SAT respectively.
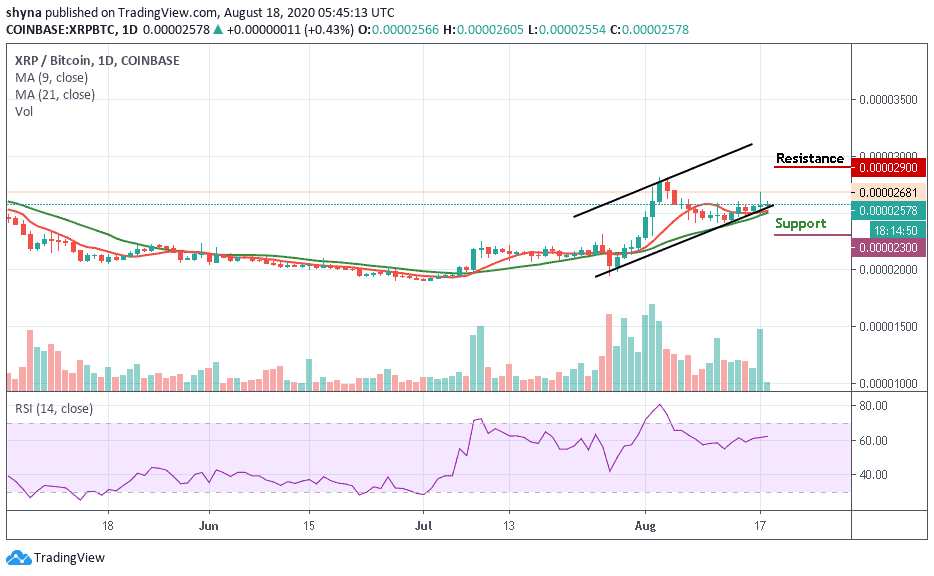
However, if the bulls failed to hold the price and allow the coin to fall below the moving averages, further dropping could bring it to the nearest supports at 2300 SAT and 2200 SAT.
Join Our Telegram channel to stay up to date on breaking news coverage