Join Our Telegram channel to stay up to date on breaking news coverage
ETH Price Prediction – August 18
ETH/USD is currently under consolidation, waiting for the next direction for the market movement.
ETH/USD Market
Key Levels:
Resistance levels: $500, $520, $540
Support levels: $360, $340, $320

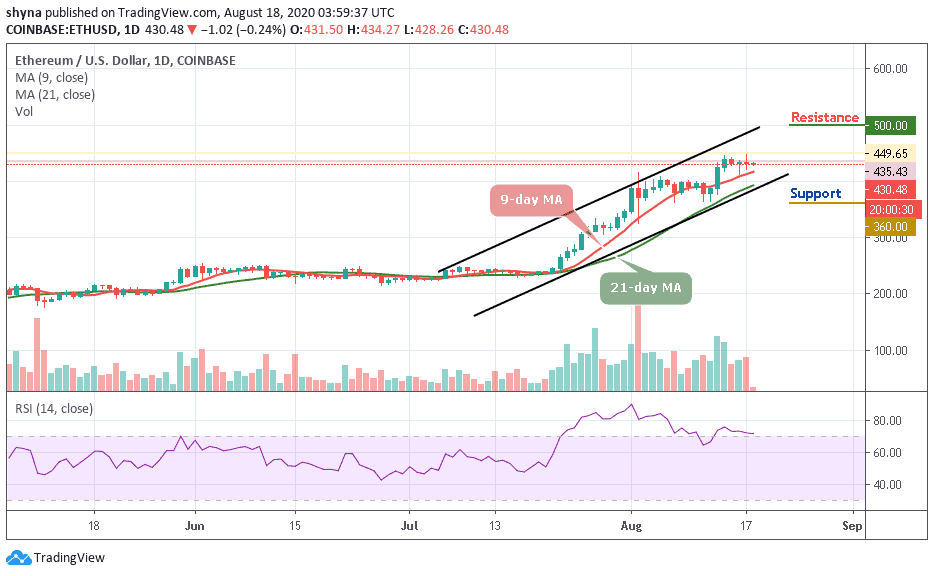
According to the daily chart, ETH/USD is currently moving in a tight range. Ethereum, the second-largest digital asset with the current market value of $45.26 billion, early this morning, tested above $430 level before retreating to the current level of $430.48. Nevertheless, the Ethereum price is seen trading under the key resistance of $450 zone but a good rally should have periods of consolidation and sideways trading before entering into another higher level.
What is Next for Ethereum (ETH)?
The price of Ethereum continues to move above the 9-day and 21-day moving averages, In the meantime, ETH/USD may be trading below $430 amid consolidation, a glance at the technical indicator shows that ETH/USD is poised for a downward action. For instance, the RSI (14) may be moving out of the overbought region, if this happens, there could be an increase in the downward pressure.
Meanwhile, on the downside, lower support is envisioned at $420 in the event declines extend below $430. Glancing towards $400, other key support levels to keep in mind are located at $360, $340, and $320 respectively. For now, the best the bulls can do is to establish support above $430 so that this could allow for consolidation in a narrow range and push for gains above $450.
Moreover, any action above $480 level may encourage more buying entries if the bulls could push for additional gains toward $500, $520, and $540 resistance levels.
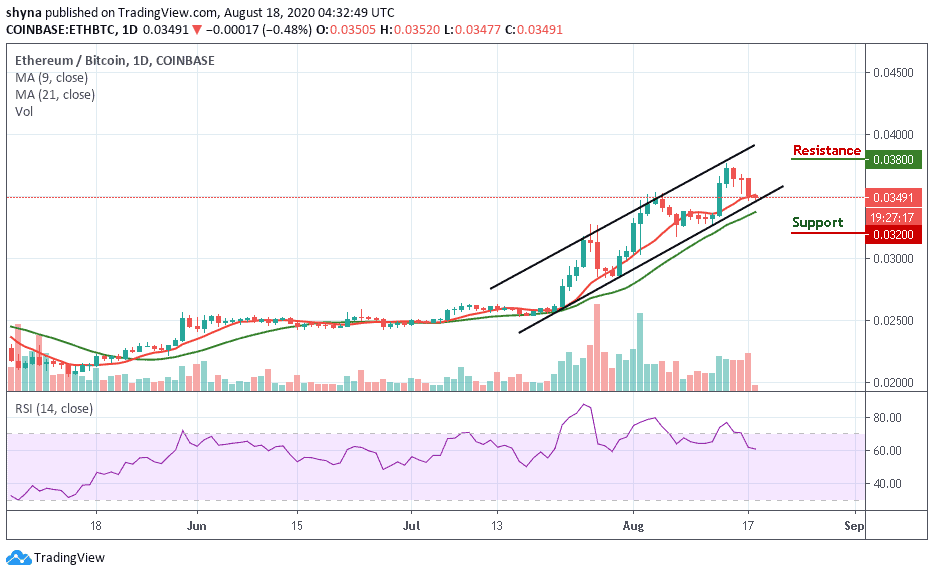
When compared with Bitcoin, the market price remained within the ascending channel as the bears are pushing to the south. The Ethereum pair is currently trading at 0.0349 BTC as the bulls are restless. Meanwhile, if the market continues to fall and breaks the lower channel, the coin may likely hit the critical support of 0.0320 BTC and below.

On the upside, if the bulls continue to hold the market price above the 9-day moving average, a possible bullish movement may likely push the market to the resistance level of 0.0380 BTC and above but the technical indicator RSI (14) is moving around 61-level, suggesting more bearish signals.
Join Our Telegram channel to stay up to date on breaking news coverage

