Join Our Telegram channel to stay up to date on breaking news coverage
Bitcoin (BTC) Price Prediction – August 17
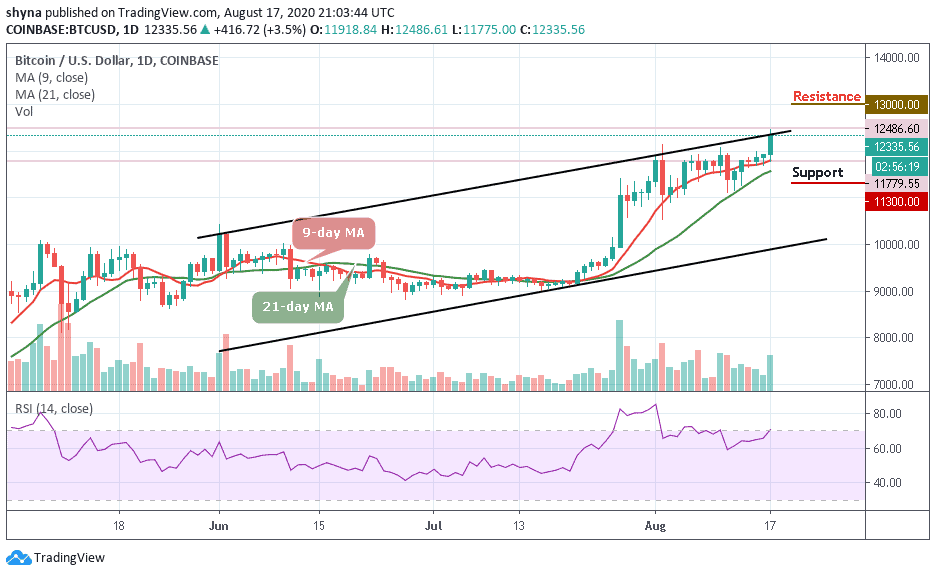
The daily chart reveals that the Bitcoin price is trading in positive territory, up 3.5% in the trading session of today.
BTC/USD Long-term Trend: Bullish (Daily Chart)
Key levels:
Resistance Levels: $13,000, $13,200, $13,400
Support Levels: $11,300, $11,100, $10,900
In the past few weeks, BTC/USD appears to be entering a full-fledged bull-run as this price action has marked an extension of the uptrend that has been seen throughout the past month, although it now appears to be picking up steam as bulls start gaining further ground against bears. However, the technical indicator of the surge in market participation rates is system traffic on major exchanges and trading platforms.
What to Expect from Bitcoin (BTC)
Today, BTC/USD extended the recovery and hit the intraday high of $12,486. BTC/USD is seen changing hands at $12,335 with over 3.5% gains since the start of the day. The local support may now be located around the 9-day moving average at $11,700. If the upside momentum is sustained, BTC/USD may increase to $13,000. This psychological barrier may slow down the bullish trend and trigger the correction towards the moving averages. If it is broken, the sell-off may be extended to $11,300, $11,100, and 10,900 support levels.
In addition, if the bulls push higher, the first level of resistance lies at $12,500. A sustainable move above $12,500 is needed for the upside to gain traction while the next important resistance may come at $12,800 above the upper boundary of the channel. Further resistance levels could be located around $13,000, $13,200, and $13,400 as the technical indicator RSI (14) moves into the overbought region.
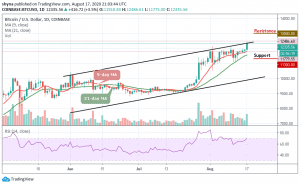
BTC/USD Medium-Term Trend: Bullish (4H Chart)
On the 4-hour chart, the bears are making an attempt to step back into the market but the bulls quickly held the support by picking the price from $12,283 to where it is currently trading at $12,344 which is around the upper boundary of the channel. Meanwhile, the $12,800 and above may come into play if BTC/USD breaks above the channel.

However, if the price drops below the moving averages and begins to fall, the support levels of $12,000 and below may be in focus. Meanwhile, as the technical indicator RSI (14) moves around 70-level, more bullish signals may play out before a reversal could come in.
Join Our Telegram channel to stay up to date on breaking news coverage