Join Our Telegram channel to stay up to date on breaking news coverage
XRP Price Prediction – July 17
The traders may experience a further decrease in price as the bearish movement becomes steadier.
XRP/USD Market
Key Levels:
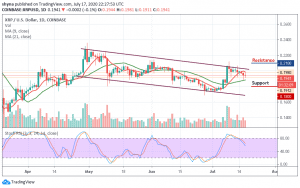
Resistance levels: $0.21, $0.22, $0.23
Support levels: $0.18, $0.17, $0.16
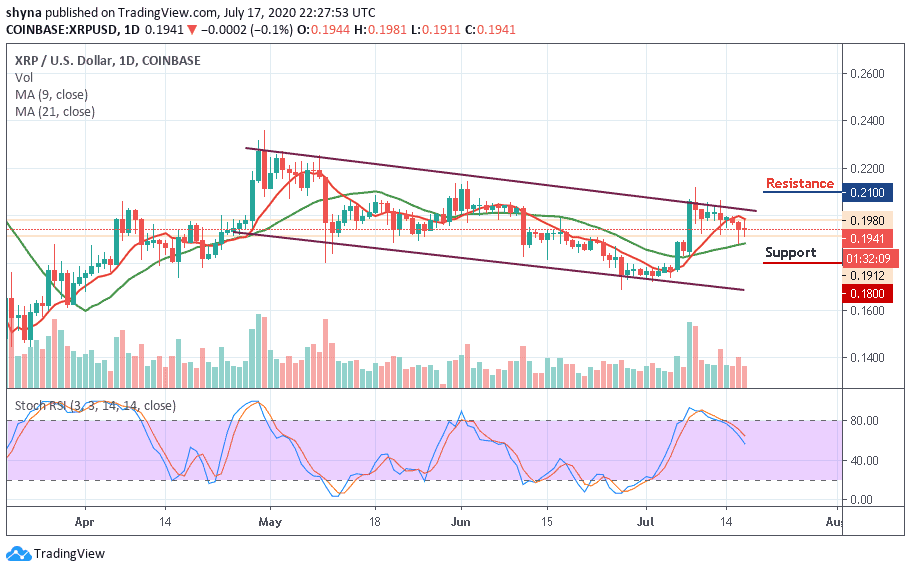
XRP/USD could not cross the upper boundary of the channel to accelerate the market price as it trades below the main support levels today. Despite the volatility chart, the Ripple price only touched the price level of $0.211 high once last week. A few hours ago, Ripple recovered from trading beneath by trading towards the 9-day and 21-day moving averages. On the daily chart, XRP/USD pair is bearish. On July 9, the Ripple (XRP) recorded a monthly high at $0.211.
More so, the buyers lose their momentum at the mentioned resistance level; the sellers took over the market at that moment and the price begins to experience declination in which the former support level of $0.194 becomes a resistance. However, the current price momentum has been less volatile, wherein the bearish movement in the price becomes steadier. The traders can expect a further decrease in price in the coming days.
However, XRP/USD may likely follow a long-term bearish trend, in case the price crosses below the 9-day and 21-day moving averages. Now, it appears that the market is about attempting a pullback; if not, the market is expected to hit the supports at $0.018, $0.017, and $0.016 as the stochastic RSI moves below 70-level. More so, if the mentioned supports fail to play out, the Ripple price may cross above the channel and move towards the resistance levels of $0.021, $0.022, and $0.023.
When pairing Ripple with Bitcoin, the market is seen to be moving below the 9-day MA and above the 21-day MA where the price is expected to break above the higher trend line at 2170 SAT. Should the price cross above the resistance level at 2200 SAT, the market may experience an upward trend that could touch the nearest resistance level of 2280 SAT and above.
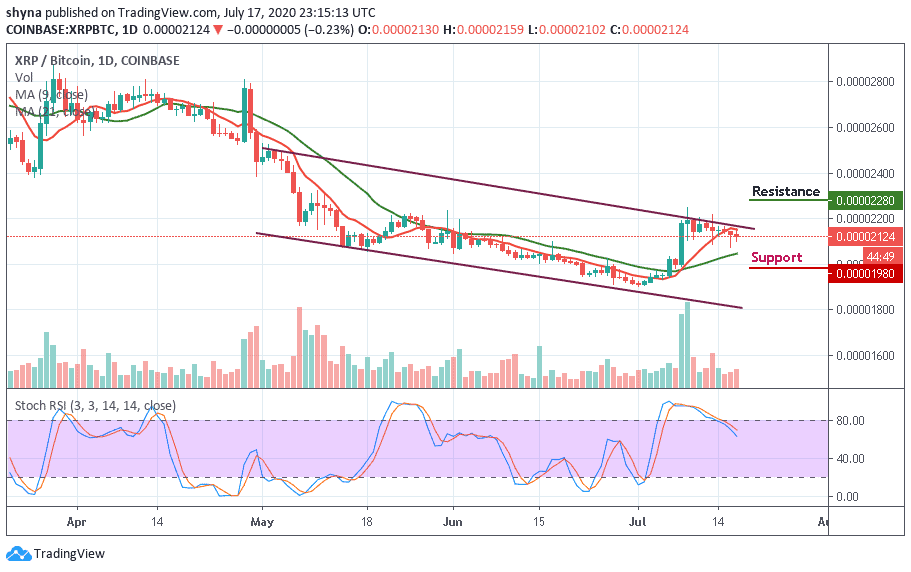
However, if the coin breaks below the moving averages; it may be exposed to long-term supports at the 2030 SAT in which it may test the critical support at 1980 SAT provided the buyers refuse to defend the nearest support level at 2100 SAT. For now, the stochastic RSI confirms that the market is been controlled by the sellers as it moves around 70-level with the signal lines bending down.
Join Our Telegram channel to stay up to date on breaking news coverage