Join Our Telegram channel to stay up to date on breaking news coverage
XRP Price Prediction – January 29
Ripple has tested resistance above $0.240 twice over the last 24 hours but currently approaching supports. The coin has maintained its range above $0.230 despite the pullback.
XRP/USD Market
Key Levels:
Resistance levels: $0.260, $0.270, $0.280
Support levels: $0.210, $0.200, $0.190
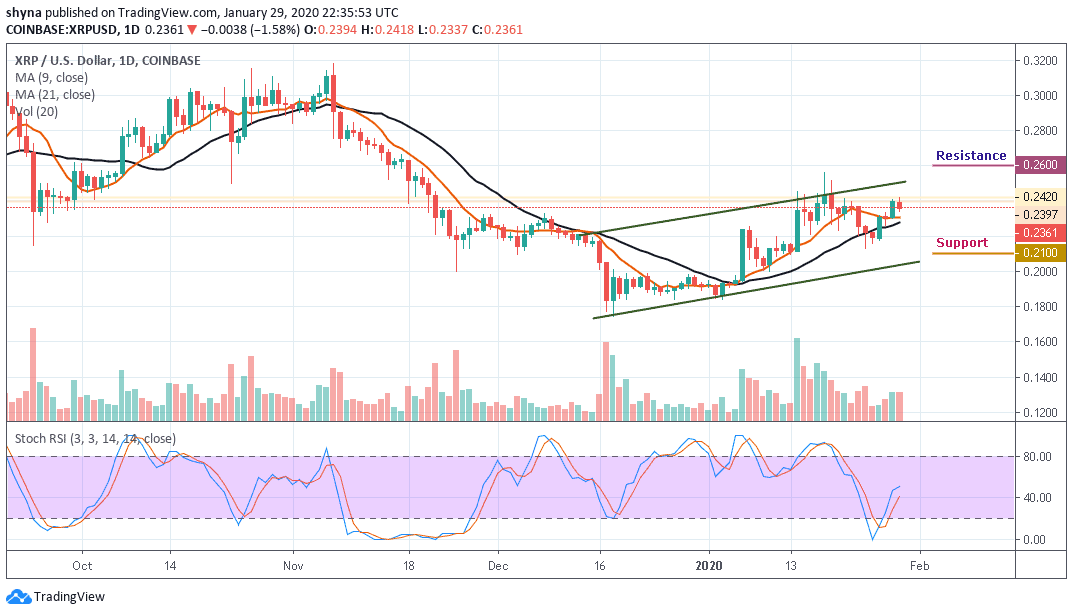
Ripple’s uptrend has been consistent for quite a time now; as the coin resumed today following an uptrend, also, in the last few hours, it has shown a bit of correction. The Asian session is characterized by a loss of 1.58% on the day. XRP/USD is trading at $0.236, although it opened today’s session at $0.239 and moved it to $0.242 before dropping to where it is currently. The bulls are intentional in their muscle-flexing. For instance, a break above the channel on the daily chart means that XRP bulls are coming up.
Moreover, XRP/USD is on the verge of maintaining a bullish trend, breaking above the moving averages some couple of days ago. Currently, the price is negotiating with resistance turned support at $0.236 but still above the 9-day moving average. The stochastic RSI indicator shows increasing bullish momentum as it moves above 40-level.
However, a significant cross above the channel could sustain the bulls to $0.240 and $0.250 highs. Meanwhile, Ripple is following an upward trend and still maintaining it. If XRP manages to surge above $0.250, it may see resistance at $0.260, $0.270 and $0.280, though a further drop may bring it to the support levels of $0.210, $0.200 and $0.190 respectively.
Against Bitcoin, XRP is still trading on the downside, although the price action has remained intact within the channel. If the selling pressure persists, the XRP price variation may likely create a new low in the few days. For now, the RSI (14) has crossed below the 40-level; we may see a negative move in the market soon.
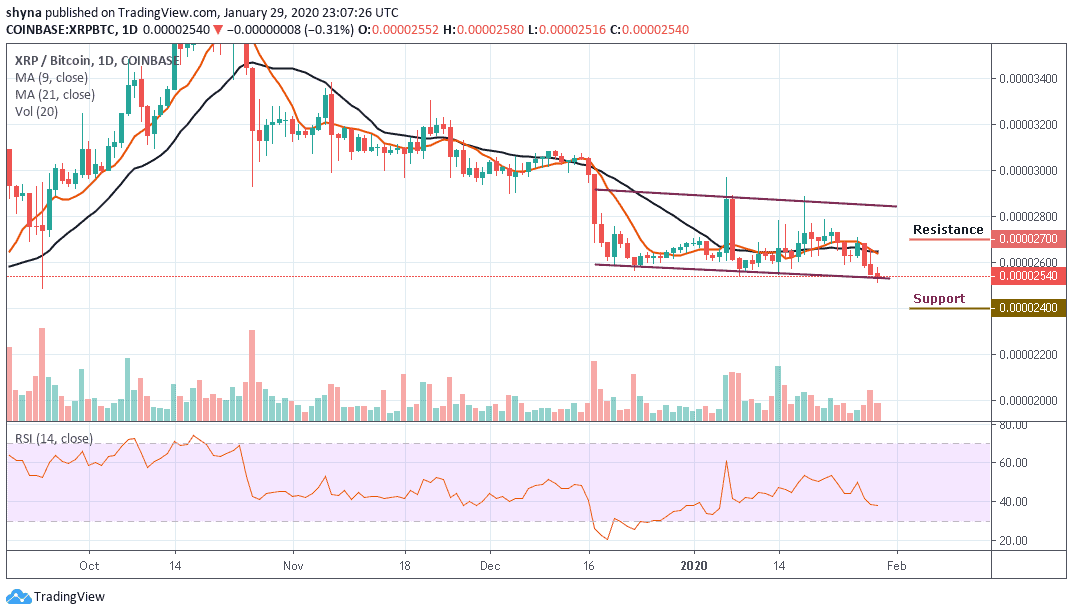
Moreover, the coin is also trading under the 9-day and 21-day moving averages at 2540 SAT. We can expect close support at the 2400 SAT before breaking to 2300 SAT and critically 2200 SAT levels. If a bullish move occurs and validates a break significantly above the moving averages, we can then confirm a bull-run for the market and the nearest resistance levels lie at 2700 SAT, 2800 SAT and 2900 SAT respectively.
Please note: Insidebitcoins.com is not a financial advisor. Do your research before investing your funds in any financial asset or presented product or event. We are not responsible for your investing results.
Join Our Telegram channel to stay up to date on breaking news coverage