Join Our Telegram channel to stay up to date on breaking news coverage
Bitcoin (BTC) Price Prediction – January 29
Bitcoin (BTC) has effortlessly zoomed above $9,300 but the upside is limited. Sustained movement below $8,500 may worsen short-term outlook.
BTC/USD Long-term Trend: Bullish (Daily Chart)
Key levels:
Resistance Levels: $10,000, $10,200, $10,400
Support Levels: $8,500, $8,300, $8,100
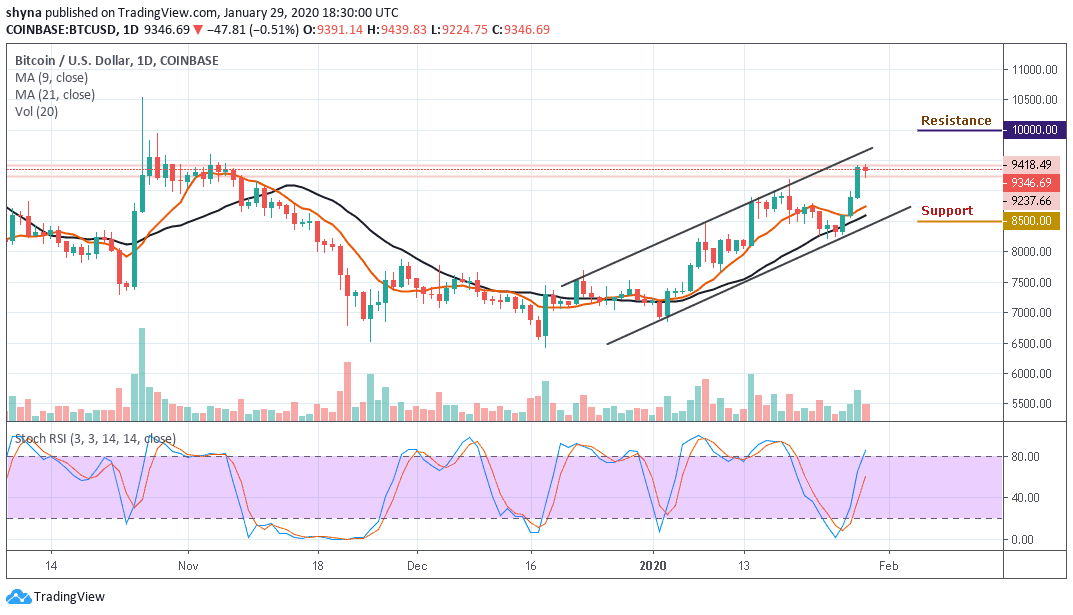
Currently, BTC/USD is following the bullish trend in the long-term outlook. A week ago, the bears lost the momentum at the support level of $8,600 and could not move above this level until a couple of days ago. The coin bounced and propelled towards the north. The price broke upside and crossed both the 9-day and 21-day moving averages after the coin surged upward but now, BTC/USD is seen trading at $9,346 resistance level.
However, Bitcoin could face a setback for the moment but the coin may likely have a continuation bullish trend in the near term and a price rally could help it hit its monthly high again. Currently, Bitcoin is trading around $9,346 level after a free fall from $9,418. Any further movement could bring it to the support levels of $8,500, $8,300 and $8,100 respectively. Moreover, as the coin is planning for a reversal, the daily chart reveals that the bulls are still in control of the market.
Meanwhile, the $9,800 and $9,600 levels may further surface as potential resistance levels if the $9,400 level holds. However, a strong bullish movement might take the price to $10,000, $10,200 and $10,400 levels. But presently, the technical levels remain positive as the stochastic RSI faces the north.
BTC/USD Medium-Term Trend: Bullish (4H Chart)
After the crypto faced a long period of upward movement within its previously established trading, Bitcoin bears are still making an attempt to step back into the market pushing the BTC price below its previous price level that existed around $9,422 to $9,322. Although the Bitcoin price has not yet slipped below $9,300, it’s still in the loop of making a bounce back.
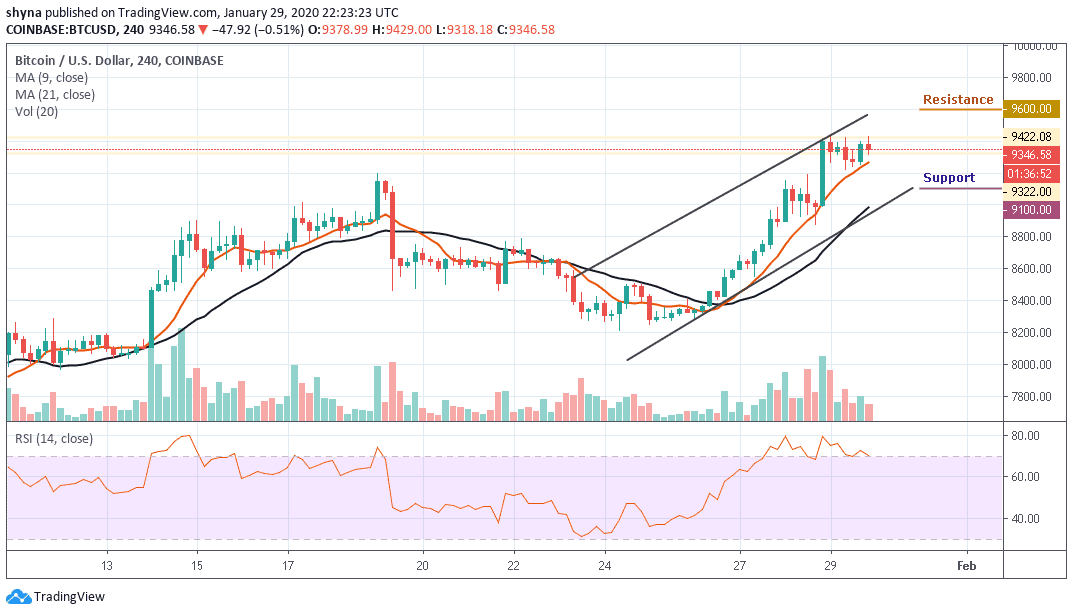
In addition, BTC/USD is currently moving within the channel but above the 9-day and 21-day moving averages. The upward movement may likely push the price across the upper boundary of the channel and to the nearest resistance at $9,600, $9,800 and $10.000 levels while the immediate and critical support lies at $9,100, $8,900 and $8,700. The RSI (14) is moving within the overbought zone.
Please note: Insidebitcoins.com is not a financial advisor. Do your research before investing your funds in any financial asset or presented product or event. We are not responsible for your investing results.
Join Our Telegram channel to stay up to date on breaking news coverage