Join Our Telegram channel to stay up to date on breaking news coverage
Ripple Price Prediction – May 21
The Ripple price is dropping heavily by 12.52% touching the daily low of $1.01 as it falls back towards the lower boundary of the channel.
XRP/USD Market
Key Levels:
Resistance levels: $1.50, $1.70, $1.90
Support levels: $0.65, $0.45, $0.25

XRP/USD continues to hold strong at $1.00 and this level has been supporting the market since a few days ago. However, it is possible that the more this support is tested, the more likely it is to break. If the Ripple price continues to abuse this support level, traders can expect more falls before getting to the lower boundary of the channel and the nearest support levels of $1.00 and $0.80 may be tested.
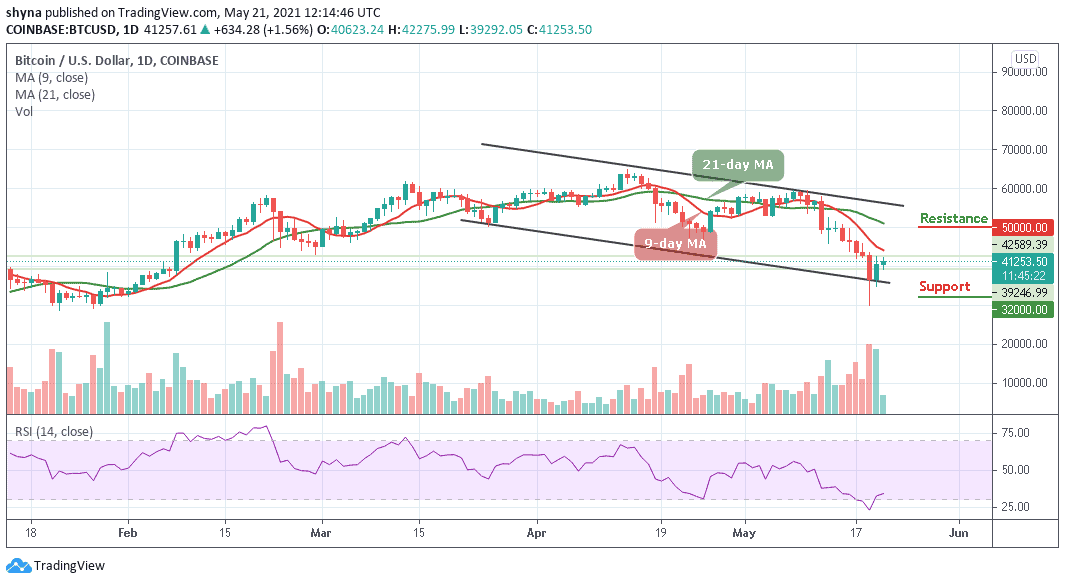
Ripple Price Prediction: Could it See Further Downtrend?
At the time of writing, the Ripple price is hovering at $1.03 with a strong bearish movement below the 9-day and 21-day moving averages. However, if the Ripple price continues to move with full force and crosses below the lower boundary of the channel, it is likely for the coin to reach the support levels of $0.65, $0.45, and $0.25 respectively.
On the other hand, if the coin makes a quick turn to the upside, it could break above the 9-day and 21-day moving averages to reach the resistance levels of $1.50, $1.70, and $1.90. Meanwhile, the technical indicator Relative Strength Index (14) is beginning to slope gradually downwards as bears may remain in control until a larger divergence to the upside is seen.
Against Bitcoin, the Ripple (XRP) has been slowly grinding lower. After bottoming out around the 2651 SAT level, the price is currently trading at 2744 SAT around the lower boundary of the channel. The Ripple price is now contained within the ascending channel as traders wait for the bulls to hopefully push the price above the 9-day and 21-day moving averages.
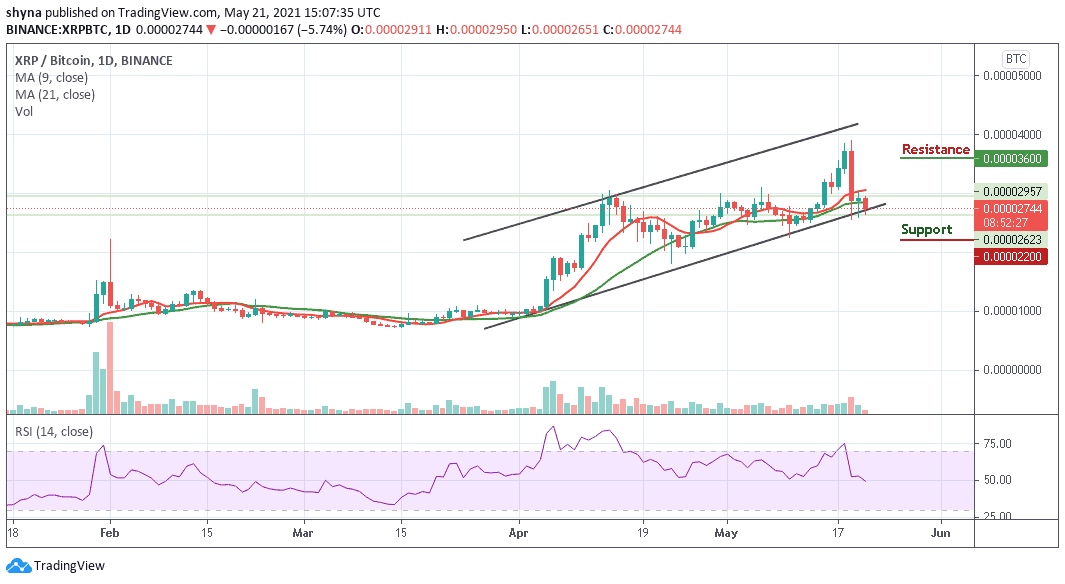
Moreover, if the bulls can break above this barrier, traders can expect initial resistance at 3200 SAT while the higher resistance lies at 3600 SAT and above. Meanwhile, looking at it from below, if the sellers push the market below the lower boundary of the channel, traders can expect supports at 2200 SAT and below. The RSI (14) is likely to cross below the 50-level to give more bearish signals.
Looking to buy or trade Ripple (XRP) now? Invest at eToro!
75% of retail investor accounts lose money when trading CFDs with this provider
Join Our Telegram channel to stay up to date on breaking news coverage