Join Our Telegram channel to stay up to date on breaking news coverage
Ripple Price Prediction – May 117
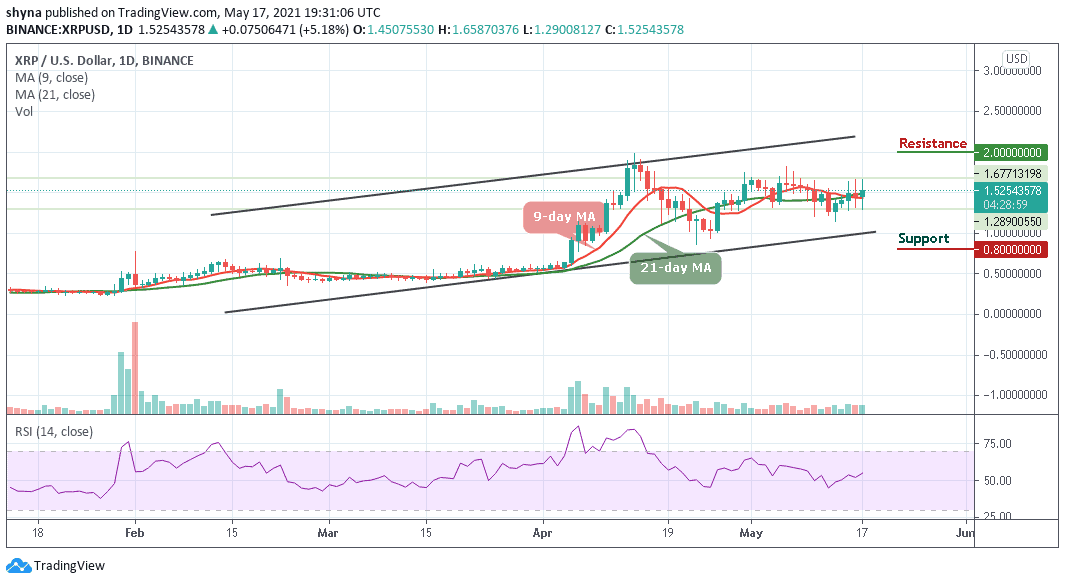
The Ripple (XRP) renews the bullish trend after testing the support level of $1.29 since the European session.
XRP/USD Market
Key Levels:
Resistance levels: $2.00, $2.20, $2.40
Support levels: $0.80, $0.60, $0.40

XRP/USD is currently following an upward roll after plunging under $1.30 to test support at $1.29 a few hours ago. The seventh-largest cryptocurrency by market capitalization has on several occasions since the month of April, been purged from highs above $1.95. A monthly high traded at $1.98 marked the end of the bullish action towards $2.00 and paved the way for losses under $1.05.
Ripple Price Prediction: Where next for XRP?
XRP/USD has commenced an intriguing recovery towards a $1.80 resistance level. The initial break above the 9-day and 21-day moving averages boosted the price up. However, the Ripple (XRP) hit highs above $1.65 before retreating back to where it is currently trading. Meanwhile, from above, more hurdles may come into play above the 9-day and 21-day moving averages and of course, the nearest resistance level is located at $1.80.
However, the trend remains in the hands of the bulls supported by the technical indicator where the Relative Strength Index (14) is trading above 50-level, building on the consistent recovery from the downside recorded on May 13. Ripple’s bullish scenario is emphasized by the RSI (14) indicator as it extends the action towards the north.
Meanwhile, a break above $2.00 and $2.20 resistance levels may most likely push the coin above the potential $2.40 resistance level while a break below the 9-day and 21-day moving averages could lead to the supports of $0.80, $0.60, and $0.40 respectively.
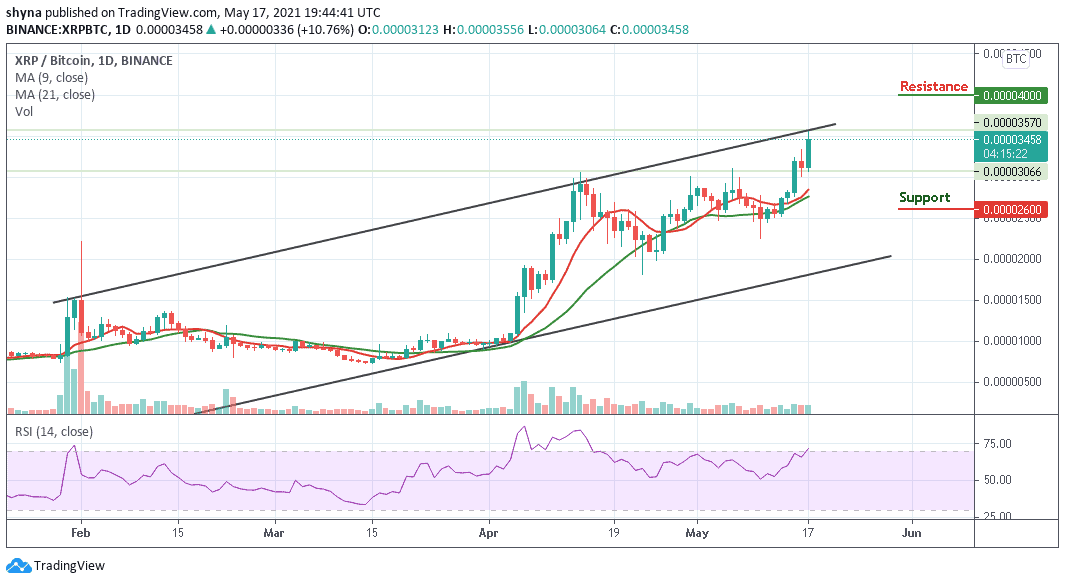
Against Bitcoin, the pair is consolidating to the upside and trading above the 9-day and 21-day moving averages. Meanwhile, the bulls are now pushing the price above the 9-day and 21-day MAs; breaking above the channel could take the price to the resistance levels of 4000 SAT and above.

However, if the XRP/BTC decides to follow the downtrend, crossing below the 9-day and 21-day MAs could push it to the critical support level of 2600 SAT and below. Meanwhile, the technical indicator Relative Strength Index (14) is moving into the overbought zone, suggesting more bullish signals.
Looking to buy or trade Ripple (XRP) now? Invest at eToro!
75% of retail investor accounts lose money when trading CFDs with this provider
Join Our Telegram channel to stay up to date on breaking news coverage

