Join Our Telegram channel to stay up to date on breaking news coverage
Bitcoin Price Prediction – May 21
The Bitcoin price is making an attempt to trade above $41,000 and the coin needs to climb above the $45,000 resistance to continue higher.
BTC/USD Long-term Trend: Bearish (Daily Chart)
Key levels:
Resistance Levels: $50,000, $55,000, $60,000
Support Levels: $32,000, $27,000, $22,000
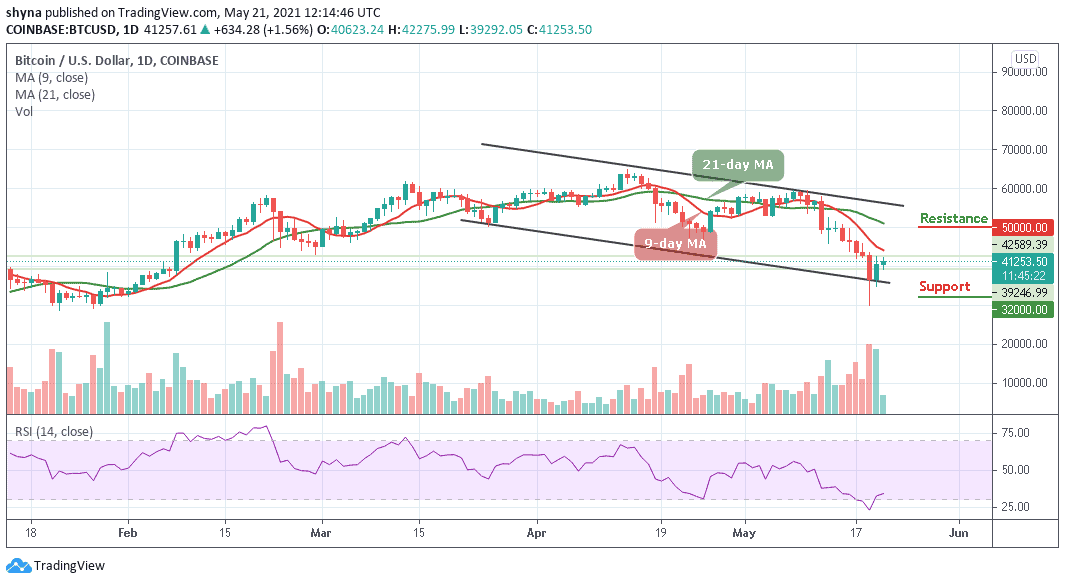
BTC/USD begins the European session with a bearish movement as the coin touched $39,292 daily low, Later, the Bitcoin price begins to improve, trying to move out of the downside to the upside. However, at the time of writing, BTC/USD has already moved up from $39,292 to $42,275 and now changing hands at $41,253.
Bitcoin Price Prediction: Would Bitcoin Go Up or Face Down?
The Bitcoin price is still finding it difficult to touch the $45,000 resistance as the coin is settling in a tight range between $39,000 and $42,000 around the lower boundary of the channel. Meanwhile, when the new uptrend movements are forming, buyers could use the 9-day and 21-day moving averages as the nearest support levels. But in as much as the 9-day MA is below the 21-day MA, the coin may continue to trade at the downside.
Furthermore, if the market decides to go down, the Bitcoin price may drop below the lower boundary of the channel and traders may see a further drop to $32,000, $27,000, and $22,000. On the contrary, the Bitcoin price may cross above the 9-day MA to hit the resistance levels of $50,000, $55,000, and $60,000 as the signal line of the Relative Strength Index (14) prepares to leave the current location and cross above the 35-level.
BTC/USD Medium – Term Trend: Bearish (4H Chart)
According to the 4-hour chart, the Bitcoin price is currently hovering at $41,290 and above the 9-day and 21-day moving averages. However, if the buyers could strengthen and increase the bullish movement, BTC/USD can touch a resistance level of $42,000.
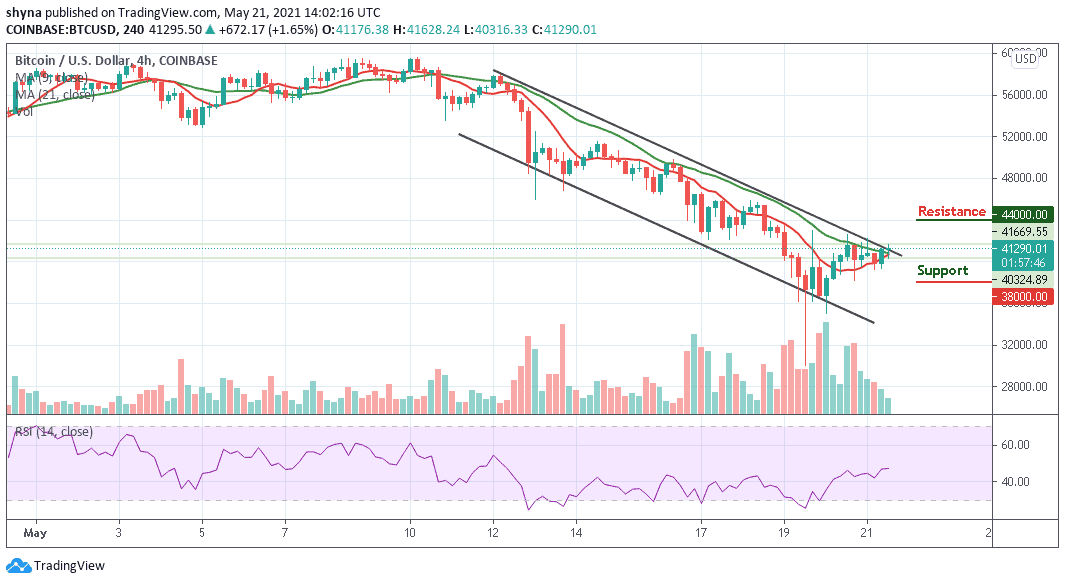
Moreover, if the price breaks above this resistance level, it could therefore touch the resistance level of $44,000 and above. Meanwhile, the Relative Strength Index (14) is currently on its way towards the 50-level, but any bearish movement may re-introduce sellers into the market which could drag the market price to the support level of $38,000 and below.
Looking to buy or trade Bitcoin (BTC) now? Invest at eToro!
75% of retail investor accounts lose money when trading CFDs with this provider
Join Our Telegram channel to stay up to date on breaking news coverage