Join Our Telegram channel to stay up to date on breaking news coverage
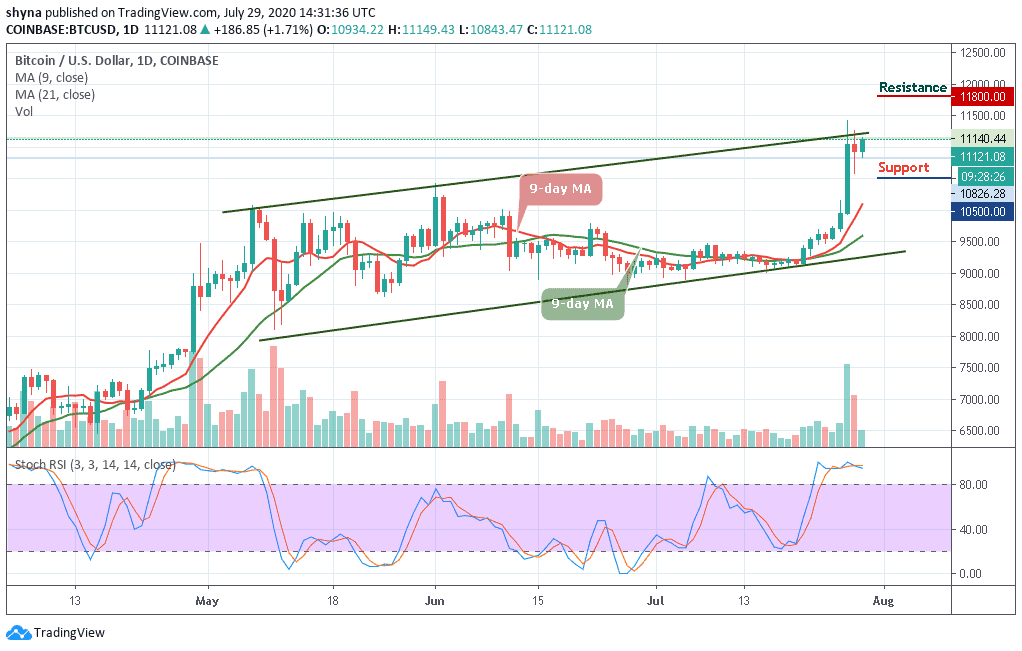
XRP Price Prediction – July 29
The Ripple (XRP) bulls retain the control of the market for the fifth straight day.
XRP/USD Market
Key Levels:
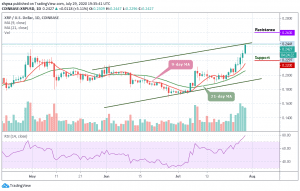
Resistance levels: $0.260, $0.270, $0.280
Support levels: $0.1220, $0.210, $0.200
Today, XRP/USD hits the daily high at $0.244 and now retreating to $0.242 at the time of writing. The coin is grossly overbought, which means it may be vulnerable to a short-term correction. However, the technical indicator RSI (14) on the daily chart is seen pointing upwards and showing no signs of reversal yet but signaling that the coin has not exhausted its bullish potential.
In addition, the initial resistance is created by the intraday high and once it is out of the way, the upside is likely to gain traction with the next focus on $0.250. In the long run, the critical barrier is created above the upper boundary of the channel at $0.250 followed by a psychological $0.260, $0.270, and $0.280 resistance levels.
At the moment, the price of the coin is changing hands at $0.242 resistance level and the bulls are still pushing the price upward. In other words, if the price decides to trade downward and move below the 9-day and 21-day moving averages; the market price could be pushed to the support levels of $0.220, $0.210, and $0.200.
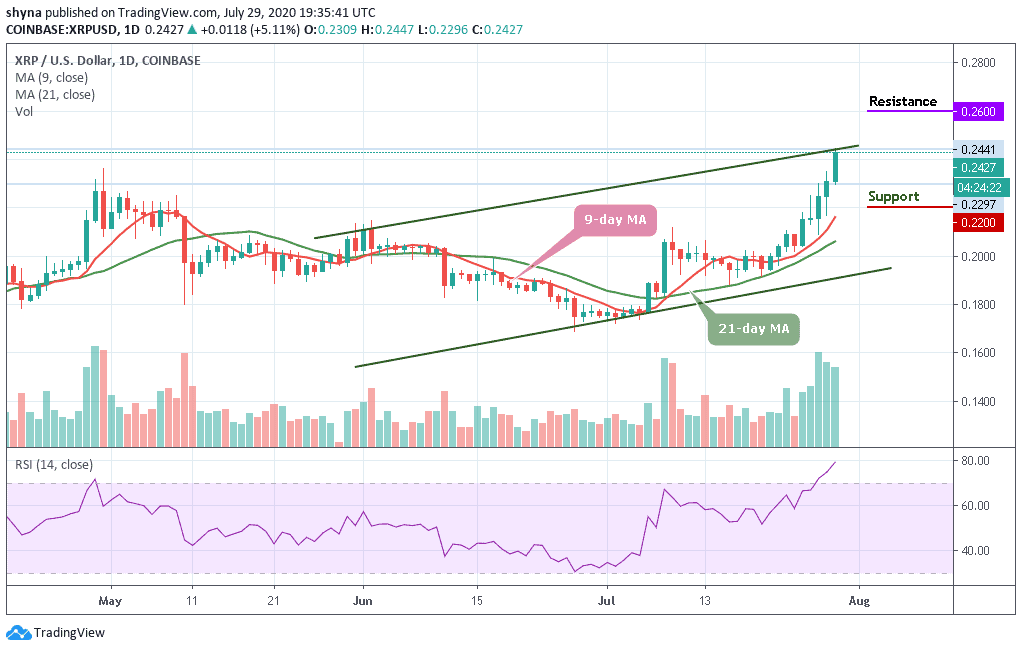
When compared with Bitcoin, the pair is consolidating within the channel and moving above the 9-day and 21-day moving averages. Meanwhile, the buyers are still making an effort to push the price above the upper boundary of the channel and the bullish continuation may take it to the resistance levels of 2300 SAT and 2400 SAT as the RSI (14) is moving to cross above the 60-level.
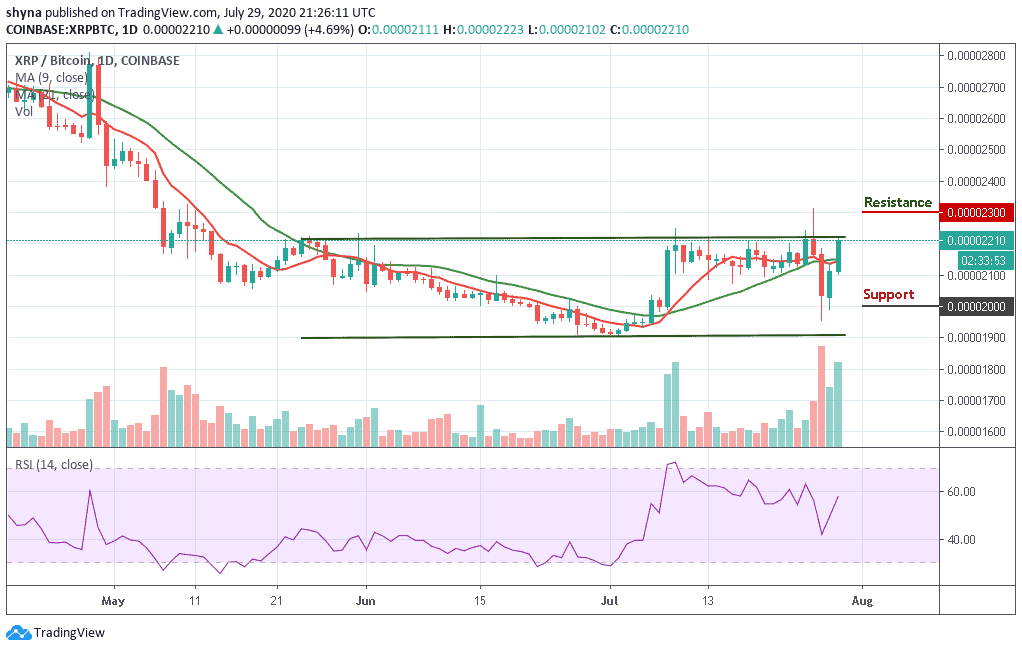
However, if the bulls failed to push the price to the north, then the bears may likely resume into the market and may trade below the moving averages, a drive below this barrier could lead to a severe bearish phase which could bring the market to the support levels of 2000 SAT and below.
Join Our Telegram channel to stay up to date on breaking news coverage