Join Our Telegram channel to stay up to date on breaking news coverage
Bitcoin (BTC) Price Prediction – July 29
Bitcoin renews the bullish picture above $11,000; the hurdles at $11,500 must be overcome.
BTC/USD Long-term Trend: Bullish (Daily Chart)
Key levels:
Resistance Levels: $11,800, $12,000, $12,200
Support Levels: $10,500, $10,300, $6,700
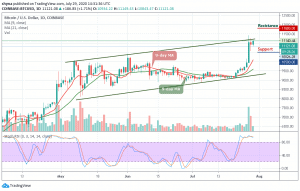
It is safe to say that BTC/USD has been doing well in recent days. The Bitcoin price rose sharply by moving above the $11,000 resistance level against the US dollar. In addition, a crucial uptrend could probably form at the upper limit of the channel and if the decline occurs below the channel, the price could extend its downward correction to the $10,800 level and any other loss could possibly push the price of Bitcoin to the support level of $10,500.
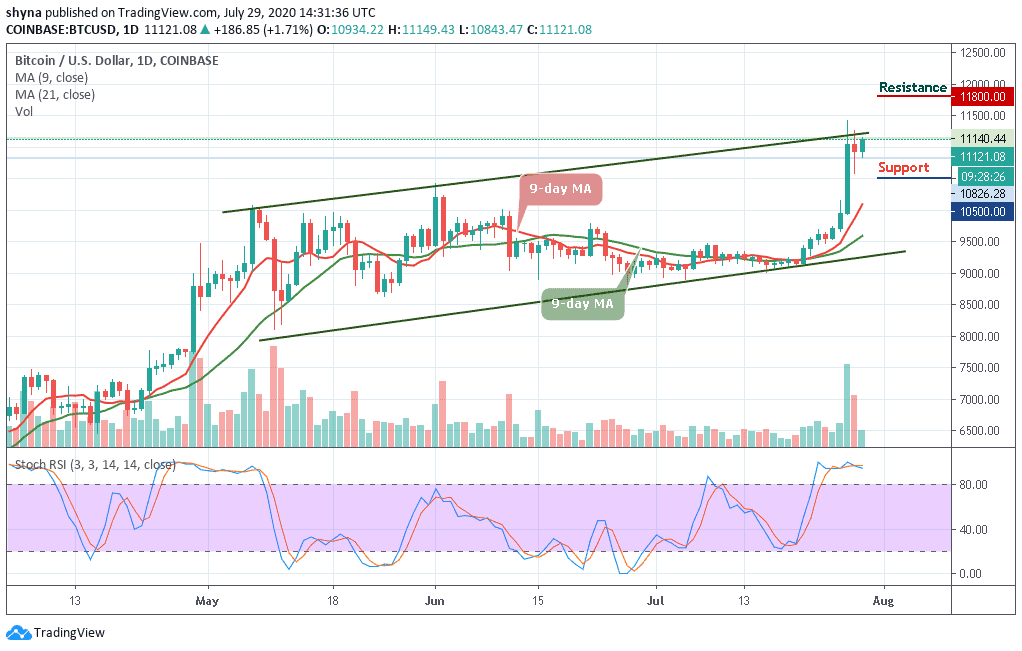
Meanwhile, looking at the daily chart, the Bitcoin (BTC) is still showing a lot of positive signs above the $11,000 and $11,100 levels. However, there are few chances of a downward move towards $10,900 or $10,800. On the upside, we have two strong resistance levels at $11,400 and $11,600. However, a strong bullish spike may take the price to $11,800, $12,000, and $12,200 levels.
Moreover, if the market makes a quick turn to the south, the BTC/USD price may likely see a price cut to $10,800, and should this support fails to contain the sell-off, traders may see a further roll back to $10,500, $10,300, and critically $10,100. The technical indicator stochastic RSI suggests an upward movement for the coin as it stays within the overbought zone.
BTC/USD Medium-Term Trend: Bullish (4H Chart)
Taking a look at the chart, we can observe Bitcoin in a 4-hour equilibrium pattern with a clear lower high at $11,312 and a higher low at $10,857. If any of these two levels break, Bitcoin will most likely get a lot of continuation in that direction. Meanwhile, the bulls are definitely the favorite right now.
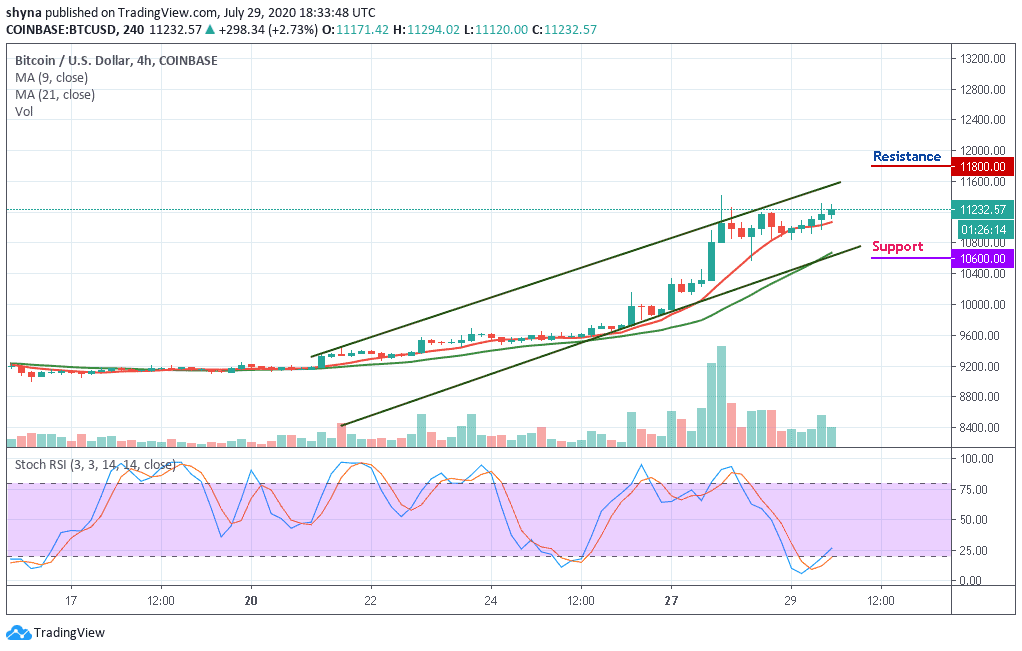
However, if there are more gains, the $11,400 level is likely to act as a major hurdle in the near term for Bitcoin. So if there is an upside break above the $11,600 resistance, the next stop for the bulls may perhaps be near the $11,800, $12,000, and $12,200 resistance levels as the stochastic RSI is moving out of the oversold region which may give more bullish signals in the market.
Join Our Telegram channel to stay up to date on breaking news coverage