Join Our Telegram channel to stay up to date on breaking news coverage
XRP Price Prediction – July 24
The Ripple (XRP) is testing resistance above $0.215 while the coin has formed a few bullish candles; the surge seems promising enough this time.
XRP/USD Market
Key Levels:
Resistance levels: $0.230, $0.235, $0.240
Support levels: $0.190, $0.185, $0.180
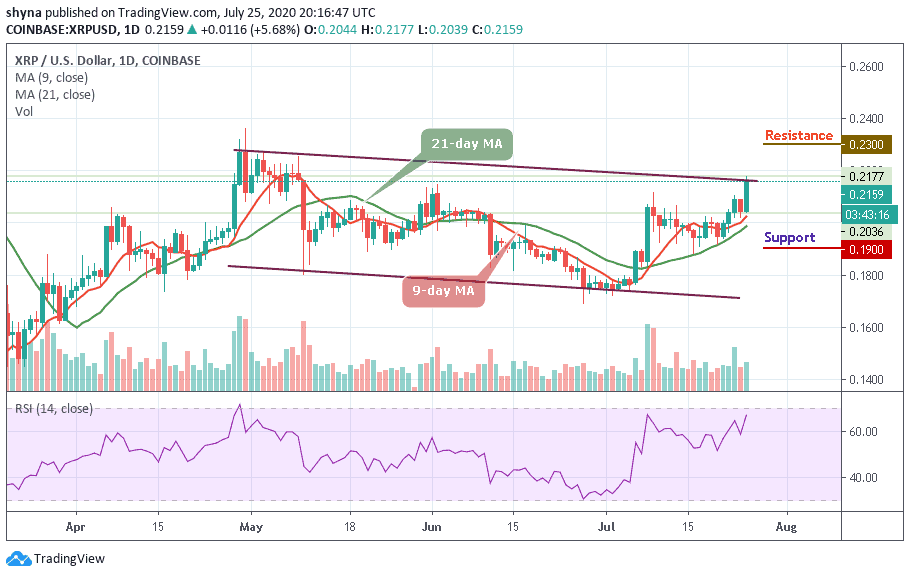
XRP/USD climbed by 5.68% today as the cryptocurrency manages to reclaim the $0.220 level since May 2. The push higher today allowed XRP to climb back above $0.210 to touch the daily high of $0.217 but the coin is now facing resistance around $0.215. Meanwhile, if the bull breaks the current daily high of $0.217 resistance, higher resistance lies at $0.220 which is above the upper boundary of the channel. This could be followed by higher resistance levels at $0.230, $0.235, and $0.240 respectively.
Moreover, the bulls must ensure that they keep the price above $0.215 and focus on breaking above the hurdle at $0.220. On the other side, if the bears push lower, support can be found below the 9-day and 21-day moving averages at $0.195. Further bearish movement may be located at $190, $185, and $180 support levels.
However, XRP/USD has corrected from the dip and it is trading above $0.215 level. The support has been established around this level amid increasing bullish activities. Looking at the technical indicator RSI (14), the daily chart reveals that the bullish grip is becoming stronger. The signal line of the technical indicator is still pointing north towards the overbought region, suggesting more bullish signals.
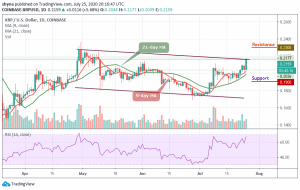
When compares with BTC, XRP is moving at the upside of the channel. Meanwhile, the price action has remained intact within the channel and if the buying pressure continues, the XRP/BTC price variation may create another monthly high. At the moment, the signal line of RSI (14) moves above 60-level; we may continue to see a positive move in the market as much as the coin continues to trade above the moving averages.

However, as the daily chart reveals, XRP/BTC is currently hovering at 2221 SAT which is around the upper boundary of the channel. Traders may expect close resistance at 2300 SAT before breaking to 2350 SAT and critically 2400 SAT levels. Should in case a bearish movement occurs and validates a break below the 9-day and 21-day moving averages; traders can then confirm a bearish movement for the market and the nearest support levels lie at 2050 SAT and below.
Join Our Telegram channel to stay up to date on breaking news coverage