Join Our Telegram channel to stay up to date on breaking news coverage
Ripple Price Prediction – September 27
Looking at the daily chart, the Ripple price prediction makes an attempt to break above the 9-day moving average as the bears take over.
XRP/USD Market
Key Levels:
Resistance levels: $1.15, $1.20, $1.25
Support levels: $0.74, $0.69, $0.64
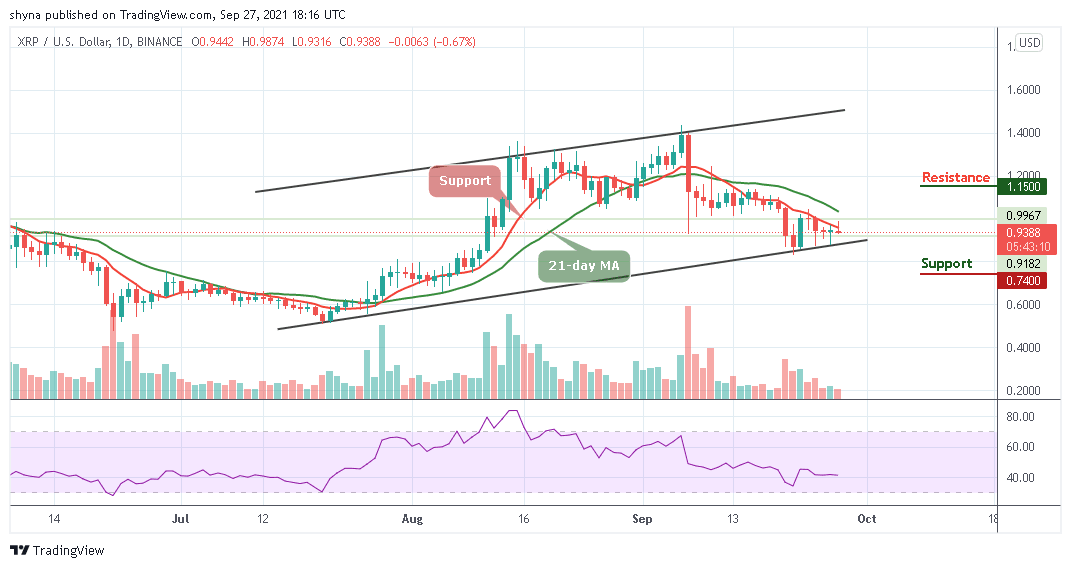
XRP/USD is seen consolidating below the 9-day and 21-day moving averages as the coin hovers around $0.93. As revealed by the daily chart, the price has partially retreated from the gain accrued today to trade at $0.93 with 0.67% lower. Meanwhile, the Ripple price needs to regain ground above the 9-day moving average to mitigate the bearish pressure.
Ripple Price Prediction: Ripple (XRP) May Begin to Move Sideways
The Ripple price is currently changing hands at $0.93 and any attempt to make it cross below the lower boundary of the channel may open the doors for more downsides and the price could spike below the $0.85 support level. However, traders should keep an eye on the $0.80 before creating a new low at the support levels of $0.74, $0.69, and $0.64.
From the upside, the buyers will need to make a sustainable move above the 21-day moving average as soon as possible to negate an immediate bearish scenario and improve the technical picture. However, for the upside to gain traction, the coin needs to regain ground above $1.10, while $1.15, $1.20, and $1.25 resistance levels are the ultimate aims for the bulls. More so, the technical indicator Relative Strength Index (14) suggests that the market may likely move in sideways as the signal line moves around 40-level.
Against Bitcoin, the Ripple (XRP) is moving on the downside below the 9-day and 21-day moving averages. If the selling pressure persists, the Ripple price variation may likely bring a new low. At the moment, the technical Indicator Relative Strength Index (14) is likely to cross below 40-level; a negative move may come to play in the market as the coin prepares to cross below the lower boundary of the channel.

However, traders may expect close support at 2600 SAT before breaking to 1900 SAT and below. Therefore, if a bullish movement occurs and validates a break above the 9-day and 21-day moving averages; we can then confirm a bull-run for the coin and the nearest resistance level lie at 2500 SAT and above.
Looking to buy or trade Ripple (XRP) now? Invest at eToro!
67% of retail investor accounts lose money when trading CFDs with this provider
Read more:
Join Our Telegram channel to stay up to date on breaking news coverage