Join Our Telegram channel to stay up to date on breaking news coverage
XRP Price Analysis – October 19
The Ripple (XRP) bulls hit resistance at $0.30, but the price may likely bounce back if the $0.27 could provide support.
XRP/USD Market
Key Levels:
Resistance levels: $0.33, $0.35, $0.37
Support levels: $0.25, $0.23, $0.21
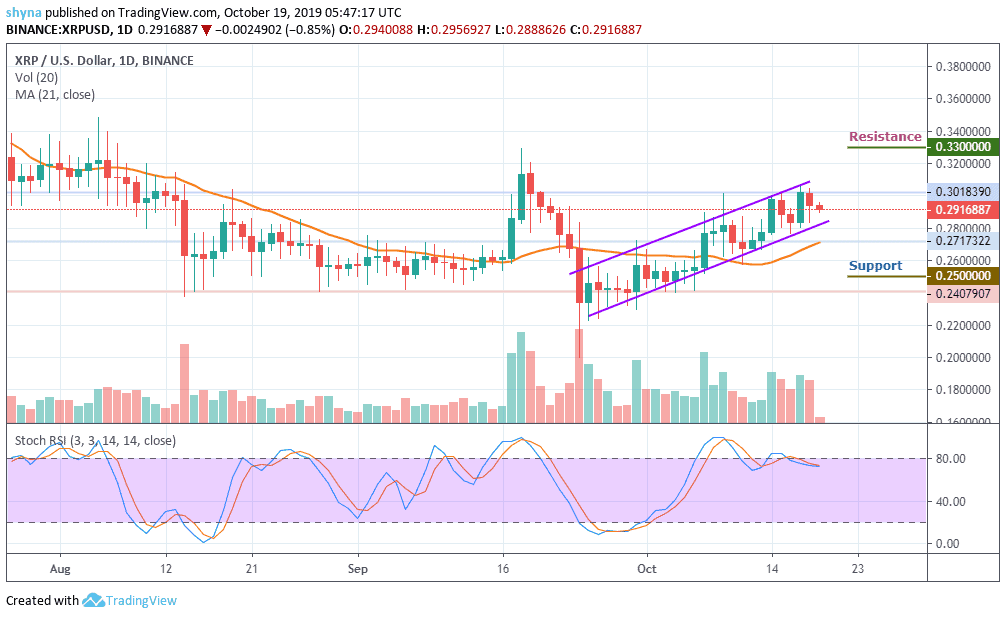
Looking at the daily chart, XRP/USD follows a bullish wedge formation but is now retreating to its lower limit. After falling from $0.30 yesterday, the price of the XRP is now closer to the $0.27 support, which could offer a rebound level for the next bullish rally. For the past three weeks, the bearish impulse movement has been suspended. Should the bears exhaust momentum around the $0.27 support level, a bullish continuation is expected to occur.
Meanwhile, if the bears are out of breath around the support area mentioned, a bullish pursuit is expected. However, we should keep an eye on the $0.30 and $0.31 before printing a new high at the resistance levels of $0.33, $0.35 and $0.37. Nevertheless, the XRP bull dictates the pace for the moment in the long term but remains bearish on the short-term outlook.
More so, we should expect a quick buy once the trade reaches the wedge’s support at $0.27. And if the price fails to rebound, then a bearish breakout is likely to trigger more selling opportunity for traders, which might cause the price to retest the August low at $0.25 and could further drop to $0.23 and $0.21 support levels respectively. The stochastic RSI still moves around the overbought zone. If the price oscillates downward, XRP may fall.
Comparing with Bitcoin, the trend of the pair is still looking bullish moving above the 21-day MA. Similarly, the coin is witnessing the same trend against USD and the bullish continuation may take the price to resistance levels of 4100 SAT and 4200 SAT respectively.
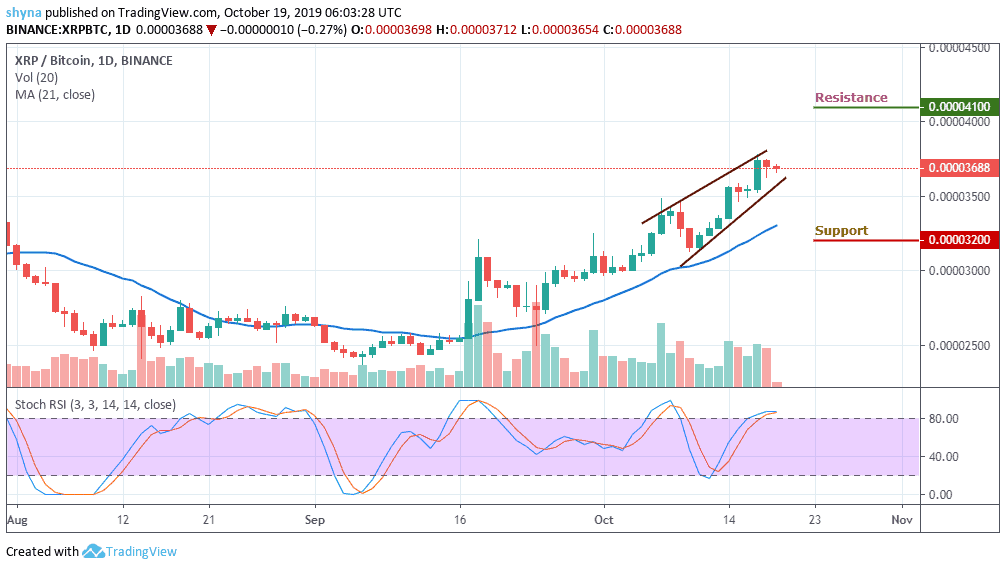
However, should the bulls failed to hold the price, then the can fall below the channel and the nearest support levels for the coin are 3200 SAT and 3100 SAT. The stochastic RSI moves into the overbought zone, which may start giving bearish signals when faces downward.
Please note: Insidebitcoins.com is not a financial advisor. Do your research before investing your funds in any financial asset or presented product or event. We are not responsible for your investing results.
Join Our Telegram channel to stay up to date on breaking news coverage