Join Our Telegram channel to stay up to date on breaking news coverage
XRP Price Analysis – April 24
The price to buy Ripple (XRP) needs to regain ground above $0.20 to continue the upward movement.
XRP/USD Market
Key Levels:
Resistance levels: $0.22, $0.23, $0.24
Support levels: $0.17, $0.16, $0.15
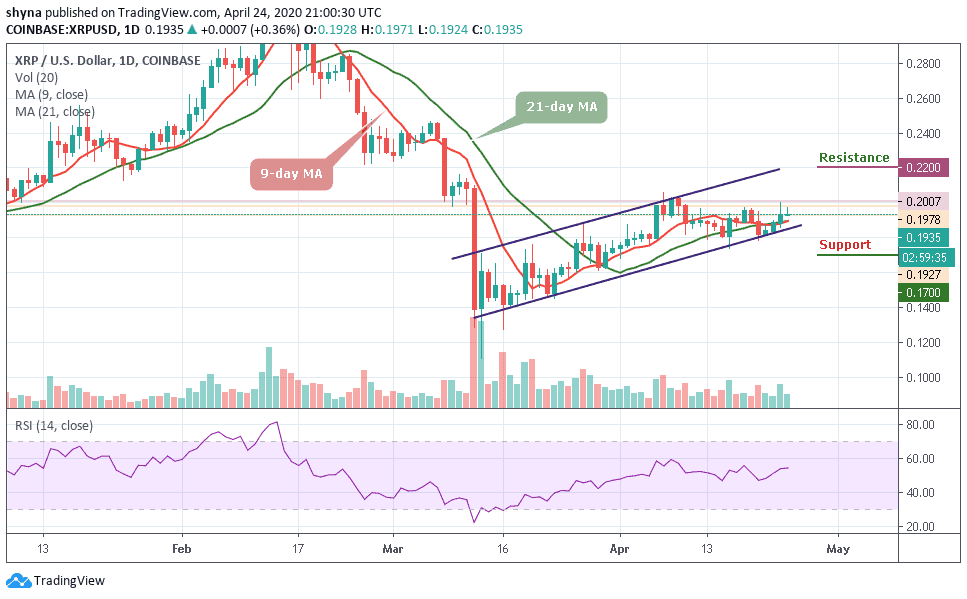
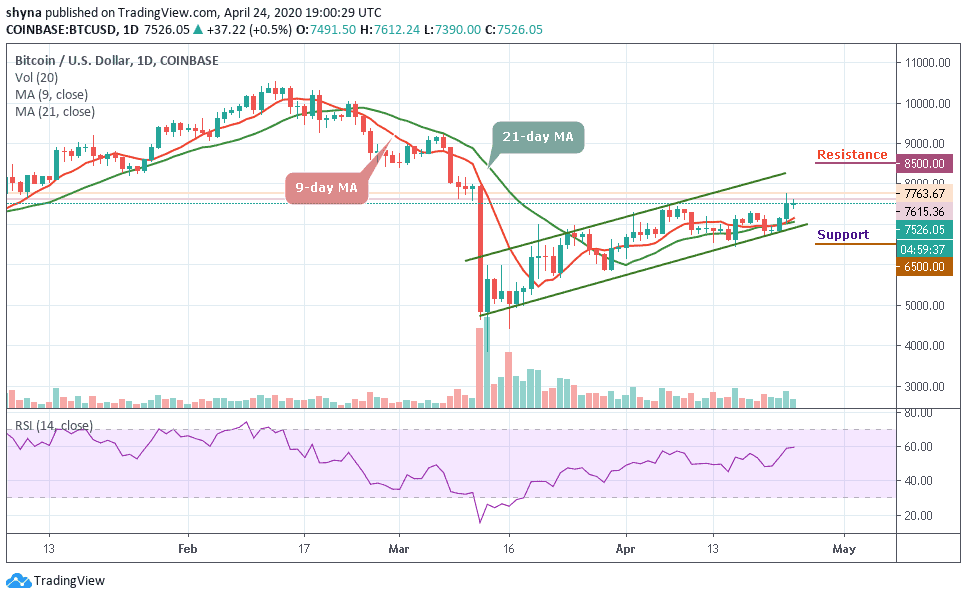
ripple price movement is giving mixed indications as the coin has violated the immediate resistance level and currently moving downwards. However, the price movement is quite slow and there are chances that it might still end the day with a positive move. Yesterday, the Ripple touched a high at $0.20 but today, the price also touched $0.197 with a gain of around 1.0%.
However, despite the recent downtrend on the market, the $0.190 remained a defensive level for the XRP market. Ripple’s XRP hit its lowest level of intraday at $0.193 at the time of writing. Although the upward trend appears to be weak, a sustained movement over this barrier will improve the long-term technical picture of the third largest coin.
Nevertheless, the movement above the 9-day and 21-day moving averages could sustain the bulls to $0.20 and $0.21 highs. Meanwhile, Ripple is currently on an upward trend and still maintaining it. If XRP manages to surge above $0.21, it may see resistance at $0.22, $0.23 and $0.24 as the RSI (1) moves above 54-level, though a further drop can take it to the support levels at $0.17, $0.16 and $0.15.
When compared with Bitcoin, XRP is currently trading at 2568 SAT and it’s trading under the 9-day and 21-day moving averages. If the above-mentioned level could serve as market support, the price can be pushed up towards the resistance levels of 2600 SAT and 2700 SAT. By reaching these levels, the price may likely visit 2750 SAT and 2850 SAT resistance levels.
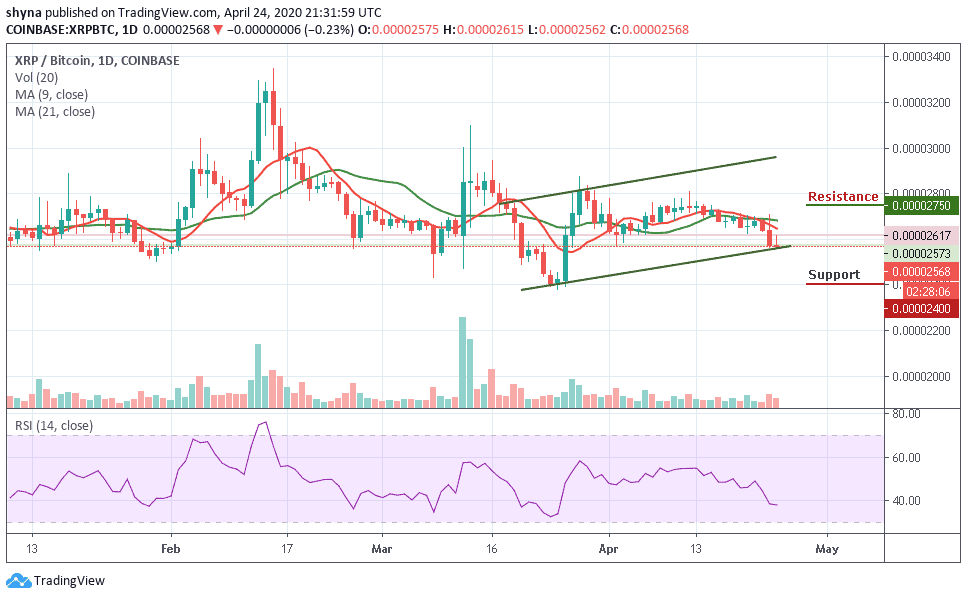
However, if the bulls fail to push the price to the nearest resistance, the market may continue the downtrend and the pair could probably record further declines at 2500 SAT. Breaking this level could push the market to the critical support levels, at 2400 SAT and below. Meanwhile, the RSI (14) also moves below 40-level suggesting more bearish signals.
Please note: Insidebitcoins.com is not a financial advisor. Do your research before investing your funds in any financial asset or presented product or event. We are not responsible for your investing results.
Join Our Telegram channel to stay up to date on breaking news coverage