Join Our Telegram channel to stay up to date on breaking news coverage
Bitcoin (BTC) Price Prediction – April 24
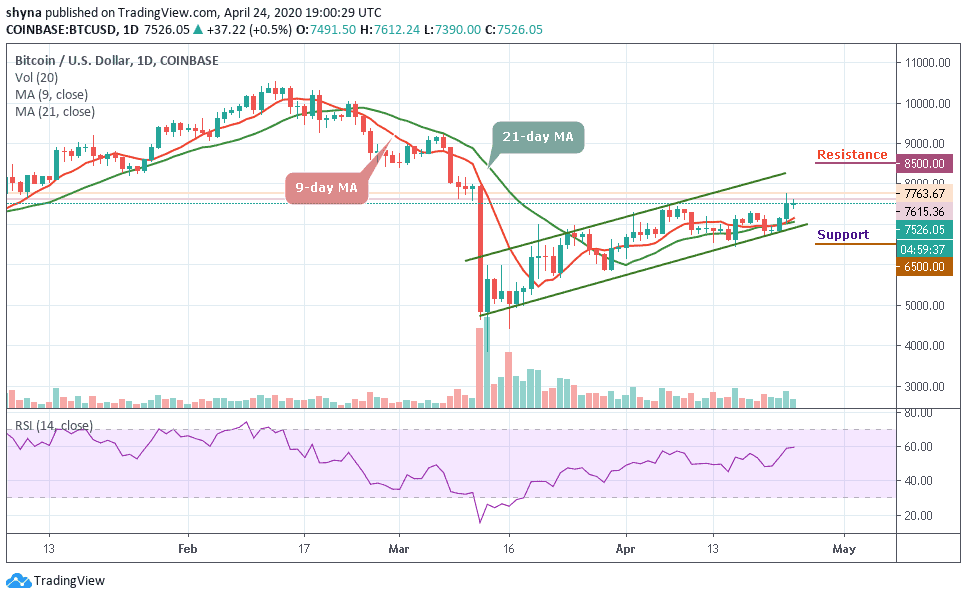
The Bitcoin price saw a further 0.5% price increase today as the cryptocurrency trades at $7,526.
BTC/USD Long-term Trend: Bullish (Daily Chart)
Key levels:
Resistance Levels: $8,500, $8,700 $8,900
Support Levels: $6,500, $6,300, $6,100

BTC/USD may start a bullish run higher if it can break above the current resistance at $8,200. The cryptocurrency exploded yesterday which allowed the coin to break above resistance at $7,200 and $7,400 as it reached as high as over $7,700. For Bitcoin to start a bullish push higher, we would need to see the resistance above the channel is broken.
However, the Bitcoin price is now considered as bullish in the short term, especially after breaking the $7,400 resistance. More so, the coin needs to tackle the $8,000 resistance level to continue the upward movement. Inversely, above the channel, resistance lies at $8,200, and $8,400. Above this, the main resistance is located at $8,500, $8,700, and $8,900.
On the other hand, if the sellers push lower, we can expect support at $6,800 and $6,600. This is followed by critical supports at $6,500, $6,300, and $6,100. In other words, the RSI (14) lies at 60-level, and the coin is seen moving in the same direction, which could cause the market to experience an indecisive movement.
BTC/USD Medium-term Trend: Bullish (4H Chart)
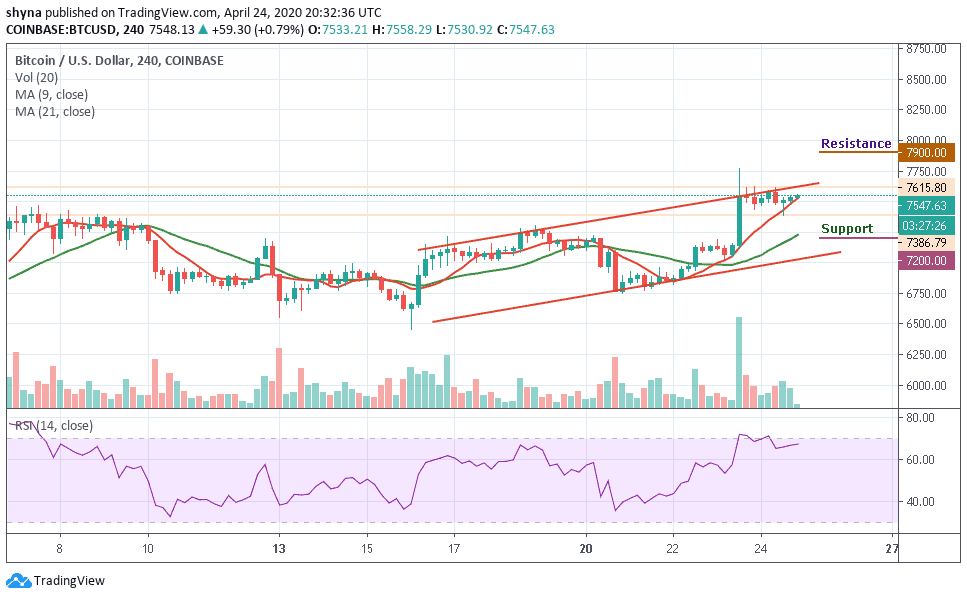
At the opening of the market today, the Bitcoin price first went up but has dropped slightly within 24 hours, bringing its price from $7,615 to reach around $7,386 support where the coin later returned to $7,547 which is the current market value at the time of writing.

Moreover, if the bears push the price to the south and continue to drop further, it may move below the channel to reach the nearest supports at $8,300, $8,100 and $7,900. But, if the bulls push the coin above the channel, the price of Bitcoin may likely reach the resistance levels of $7,900, $8,100 and $8,300. At the moment, the market may likely continue the upward movement as the RSI (14) indicator faces the overbought zone.
Please note: Insidebitcoins.com is not a financial advisor. Do your research before investing your funds in any financial asset or presented product or event. We are not responsible for your investing results.
Join Our Telegram channel to stay up to date on breaking news coverage

