Join Our Telegram channel to stay up to date on breaking news coverage
XRP Price Prediction – June 15
XRP/USD is following a decent rise over the past few hours as the coin now appears to be resuming a bullish run.
XRP/USD Market
Key Levels:
Resistance levels: $0.22, $0.23, $0.24
Support levels: $0.16, $0.15, $0.14
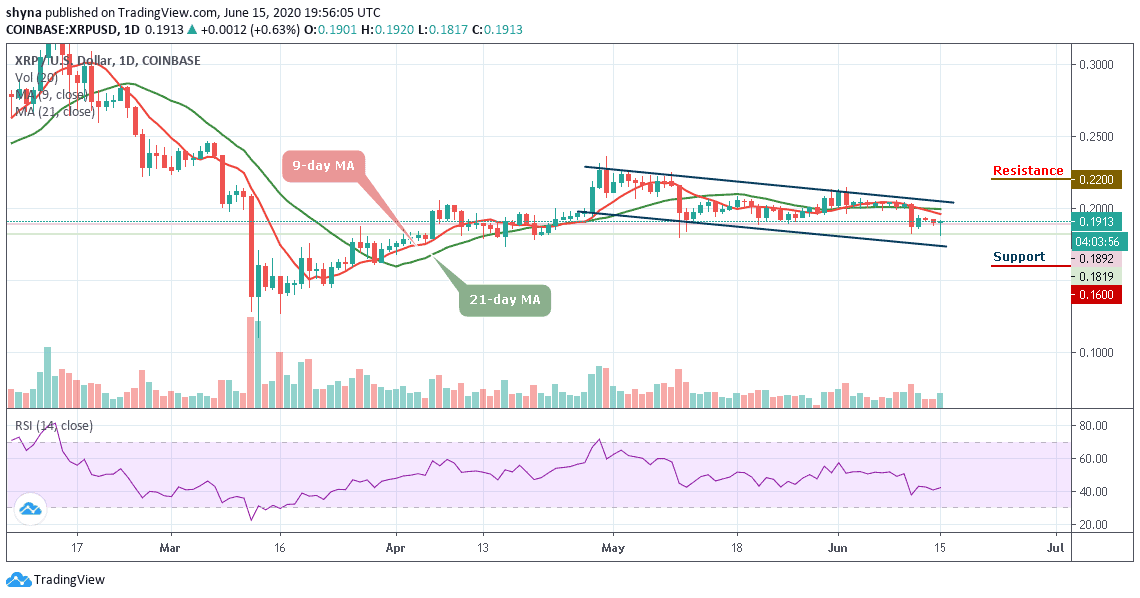
XRP/USD is making a small increase of around 0.63% as the market rebounds from the daily low of $0.181 and currently trading at $0.191 below the 9-day and 21-day moving averages. The coin is still having hard times moving above the moving averages as the previous attempts so far have failed. Despite this, the Ripple (XRP) still remains the fourth-largest cryptocurrency with a market cap of $8.48 billion.
Nevertheless, since the past few days, the Ripple price continues to move sideways to the extent that the market remains below the moving averages. At the same time, the movement to a downward trend has been consistent. In the early hours of today, the Ripple price has gone up from $0.181 to $0.191.
Furthermore, a significant cross above the channel could sustain the bulls to $0.21 high. Meanwhile, Ripple is currently on the downward trend and further bearish movement may hit the supports at $0.16, $0.15, and $0.14. But if the coin manages to surge above $0.21, it may see the resistance levels at $0.22, $0.23, and $0.24. The RSI (14) indicator remains above 40-level moving in the same direction.
Against Bitcoin, before this time, the market price is seen moving sideways and trading within the descending channel. For now, XRP/BTC is trading at the 2035 SAT and expecting a break below the channel. Now, merely looking at the daily chart, both the bulls and the bears are struggling with who will dominate the market.
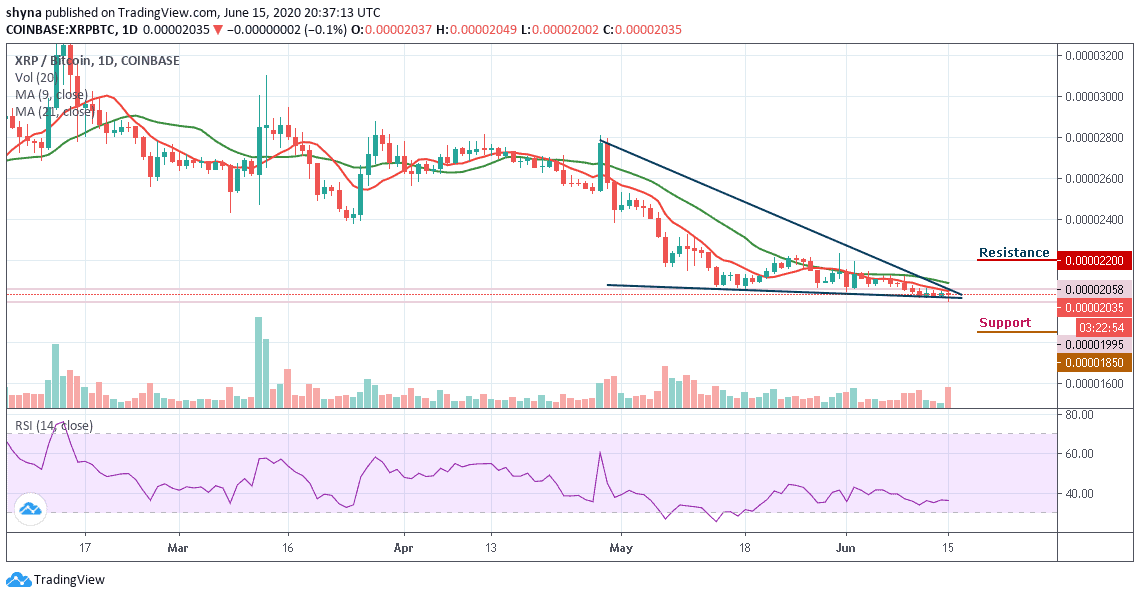
However, if the market drops, the next key supports will likely be at the 1850 SAT and below. On the bullish side, a possible rise could push the market to the resistance levels of 2200 SAT and above. According to the RSI (14), the market is moving in sideways around 36-level, which could trigger more bearish signals in the market soon.
Please note: Insidebitcoins.com is not a financial advisor. Do your research before investing your funds in any financial asset or presented product or event. We are not responsible for your investing results.
Join Our Telegram channel to stay up to date on breaking news coverage