Join Our Telegram channel to stay up to date on breaking news coverage
The Ripple price prediction has not been able to develop the upside momentum above $0.40 as the coin ranges within the market.
Ripple Prediction Statistics Data:
- Ripple price now – $0.39
- Ripple market cap – $18.8 billion
- Ripple circulating supply – 48.3 billion
- Ripple total supply – 99.9 billion
- Ripple Coinmarketcap ranking – #6
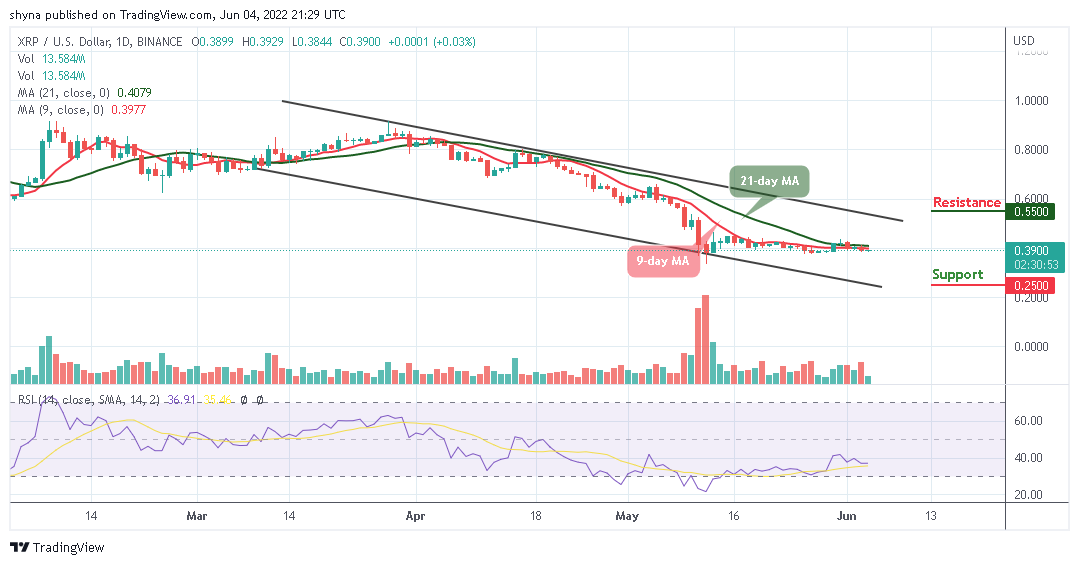
XRP/USD Market
Key Levels:
Resistance levels: $0.55, $0.60, $0.65
Support levels: $0.25, $0.20, $0.15
XRP/USD touches the resistance level of $0.39 at the opening of the market today, but the coin could not cross above the 9-day and 21-day moving average as it quickly retreated towards $0.38 support. However, the Ripple (XRP) remains at a tight range which limited its bullish movements above the moving averages.
Ripple Price Prediction: What could be the Next Direction of XRP?
According to the daily chart, the Ripple price keeps following the same direction as the coin moves toward the east. However, if the bulls manage to push the Ripple price above the 9-day and 21-day moving averages; it could find the resistance levels at $0.55, $0.60, and $0.65.
Meanwhile, if the market follows the bearish movement, it could hit the nearest support at $0.35, and a further drop could pull the coin to the support levels of $0.25, $0.20, and $0.15. Presently, the technical indicator Relative Strength Index (14) confirms the sideways movement as the signal line stays below the 40-level. Therefore, traders should keep monitoring the movement for the next possible direction of the Ripple price.
When compared with Bitcoin, the Ripple price is also seen moving sideways, although the price action has remained intact below the 9-day and 21-day moving averages. But, if the selling pressure surface, the Ripple bears may create a new low for the coin in the next coming trading days.
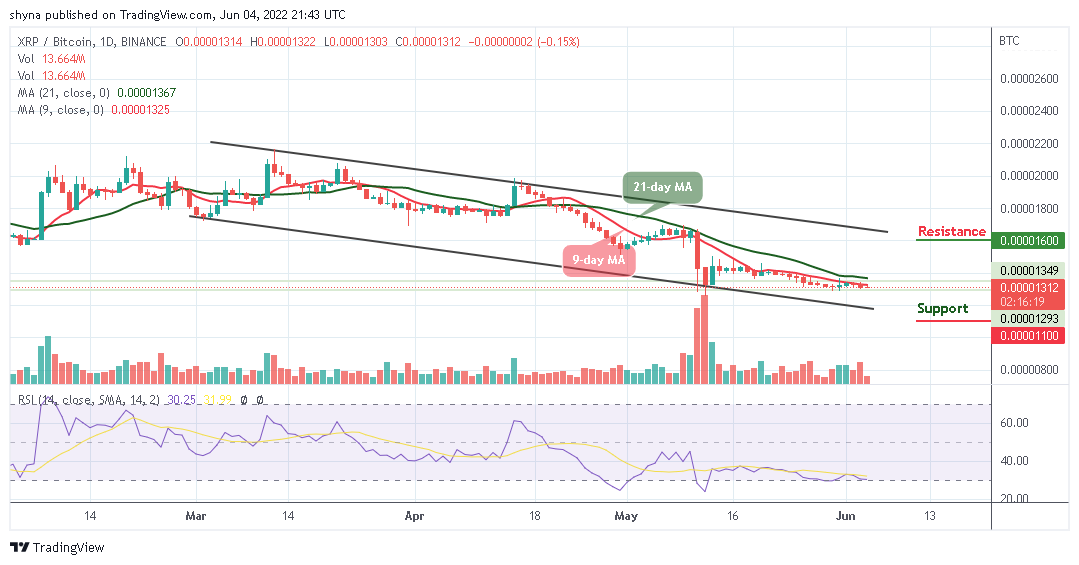
At the moment, the technical indicator Relative Strength Index (14) is moving in the same direction; traders may likely see a negative move if the bears increase their movement and any further bearish movement below the lower boundary of the channel could hit the critical support of 1100 SAT and below. On the other hand, if the bulls push the coin above the 9-day and 21-day moving averages, the nearest resistance level may be located at 1600 SAT and above.
Join Our Telegram channel to stay up to date on breaking news coverage