Join Our Telegram channel to stay up to date on breaking news coverage
The Ripple price prediction shows that XRP is slightly ranging as the market continues to respect the $0.30 support.
Ripple Prediction Statistics Data:
- Ripple price now – $0.31
- Ripple market cap – $15.4 billion
- Ripple circulating supply – 48.34 billion
- Ripple total supply – 99.89 billion
- Ripple Coinmarketcap ranking – #7
XRP/USD Market
Key Levels:
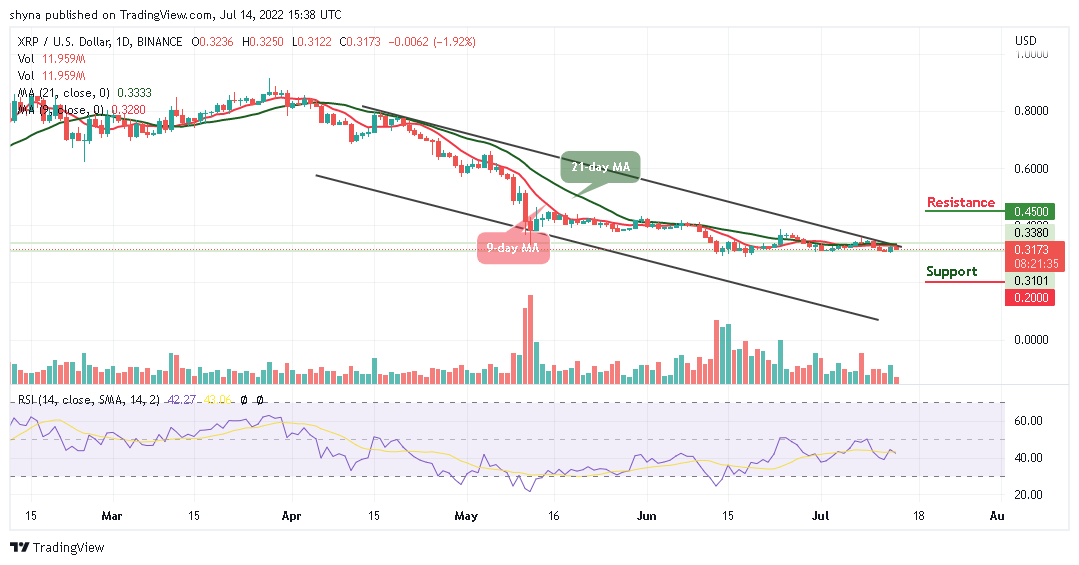
Resistance levels: $0.45, $0.50, $0.55
Support levels: $0.20, $0.15, $0.10
XRP/USD is trading sideways, losing around 1.92% during the negotiation today. Looking at the daily chart, the Ripple has been moving sideways for the past few weeks. Now, the bulls are trying to come back into the market with a cross above the 9-day and 21-day moving averages, but the sellers are putting more pressure on the market.
Ripple Price Prediction: Would Ripple Price Cross Above the Moving Averages?
The Ripple price is consolidating within the market at the time of writing and the coin has seen a slight increase in the market as it is currently trading around $0.31. In the meantime, XRP/USD may continue to a sideways movement if the coin stays below the moving averages.
However, should in case the price breaks above the upper boundary of the channel, the resistance levels of $0.45, $0.50, and $0.55 could be visited. Meanwhile, for a backward movement, the market can be supported at $0.20 and $0.15, and should the price falls below the previous levels, another support is around $0.10 while the Relative Strength Index (14) is moving below the 50-level.
When compared with Bitcoin, the Ripple price is currently changing hands at 1576 SAT, and it’s trading below the 9-day and 21-day moving averages. Therefore, if the crosses are above the moving averages, the Ripple price may likely face the key resistance at 1600 SAT. By reaching this level, XRP/BTC could climb above the upper boundary of the channel to hit the resistance level of 1900 SAT and above.
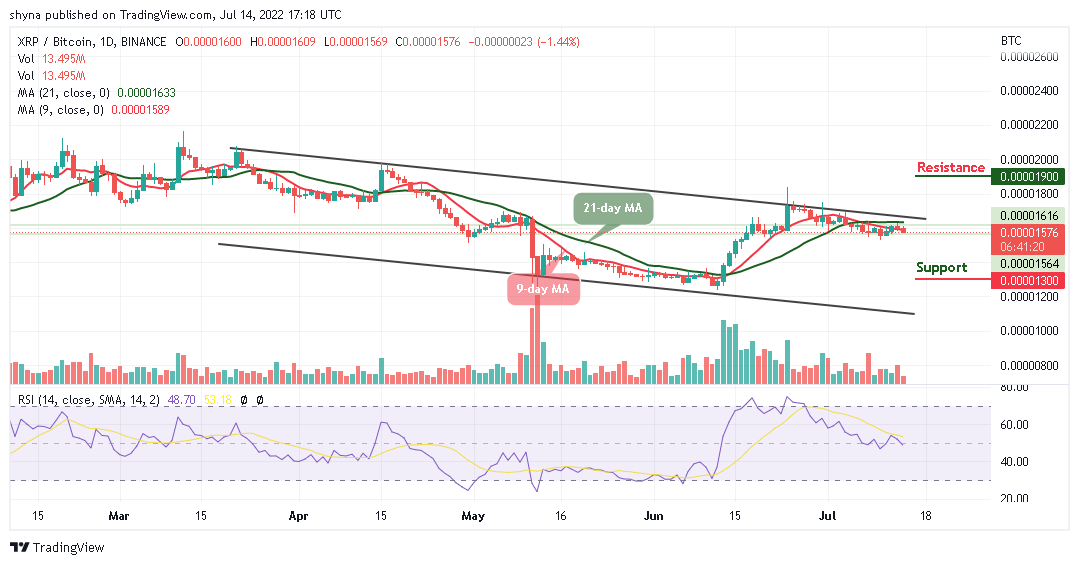
However, if the bulls fail to push the price above the moving averages, the market may begin its downtrend and the coin could probably record further declines toward the lower boundary of the channel to hit the support level at 1300 SAT and below while the signal line of the Relative Strength Index (14) moves to cross below the 50-level.
Join Our Telegram channel to stay up to date on breaking news coverage