Join Our Telegram channel to stay up to date on breaking news coverage
The Ripple price prediction shows that XRP is down by 0.29% in the last few hours as the current market value goes below $0.38.
Ripple Prediction Statistics Data:
- Ripple price now – $0.37
- Ripple market cap – $18.2 billion
- Ripple circulating supply – 48.34 billion
- Ripple total supply – 99.98 billion
- Ripple Coinmarketcap ranking – #6
XRP/USD Market
Key Levels:
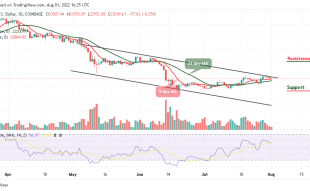
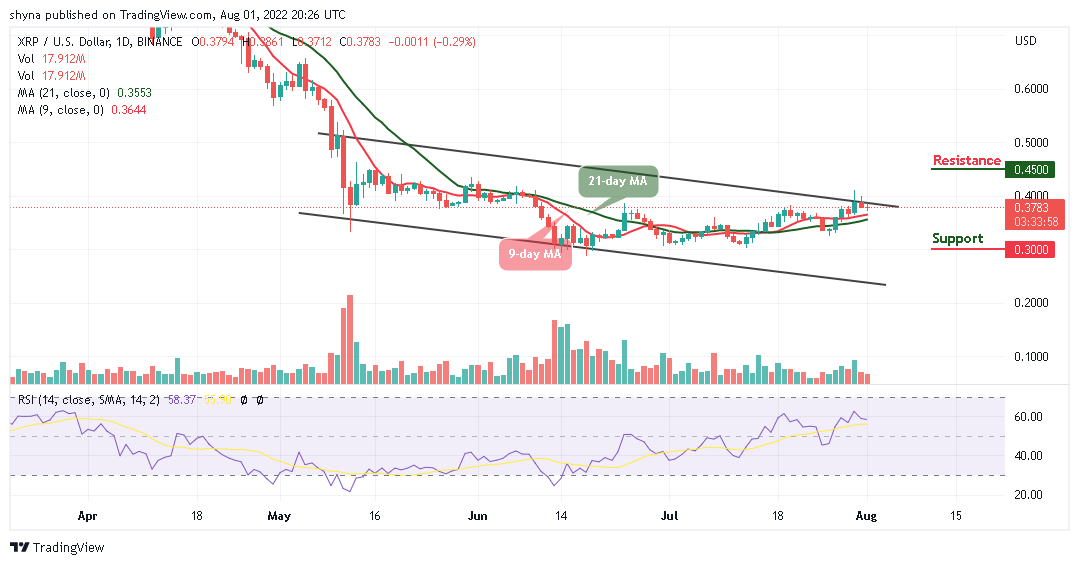
Resistance levels: $0.45, $0.50, $0.55
Support levels: $0.30, $0.25, $0.20
XRP/USD touches the daily high at $0.38 before giving a bearish signal at the time of writing, the coin is trading above the 9-day and 21-day moving averages while the Relative Strength Index (14) is seen below the 60-level. However, any bearish move below this level could give the market enough strength to dig dip, but crossing above the upper boundary of the channel could lead the market to the upside.
Ripple Price Prediction: XRP/USD May Slide to the Downside
The Ripple price is showing a sign of weakness across its markets as the coin is down by 0.29%, reflecting a price drop in the market, and the fall might become heavy if the bearish action continues. Therefore, since the Ripple price is moving sideways, traders can expect the trend to keep moving lower if the price action crosses below the 9-day and 21-day moving averages.
Meanwhile, a break above the channel could strengthen the bulls and may force the price to hit the resistance levels of $0. 45, $0.50, and $0.55, but a breakdown below the moving averages may lead the market to a bearish scenario where the price could reach the supports at $0.30, $0.25, and $0.20.
When compared with Bitcoin, the Ripple price is hovering above the 9-day moving average. Therefore, if the bears pressurized the market, XRP/BTC may create another low by touching the nearest support at 1600 SAT. Now, the technical indicator Relative Strength Index (14) is moving to cross above the 60-level; traders may see a positive move within the channel if the bullish pressure increases.
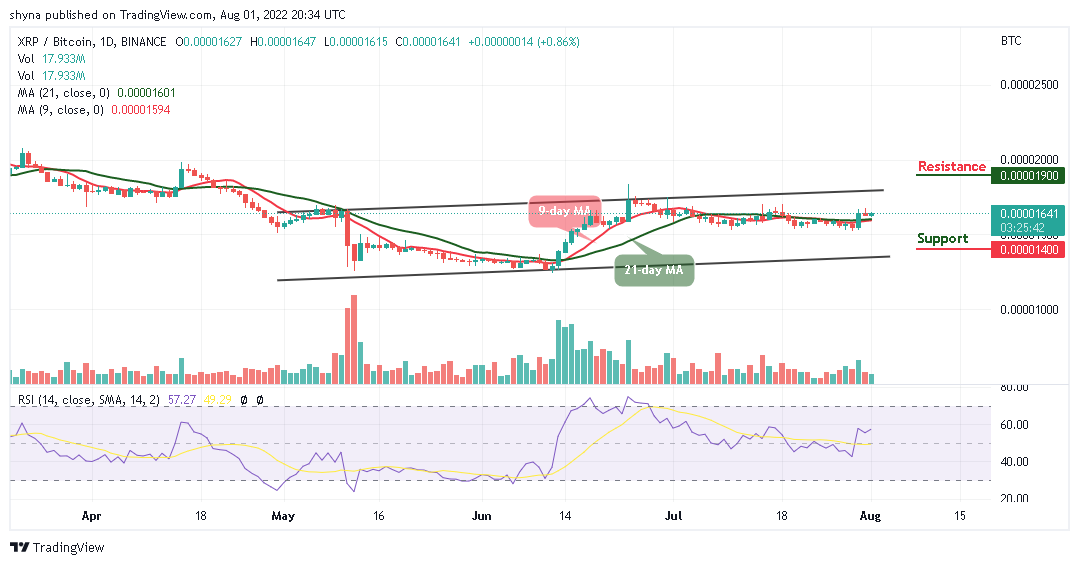
However, the Ripple (XRP) is changing at 1641 SAT. If the coin drops below the current value, the market may hit the support at 1400 SAT and below. Nevertheless, if the Ripple price moves toward the upper boundary of the channel; traders can then confirm a bull run for the market, and the nearest resistance level may be located at 1900 SAT and above.
Join Our Telegram channel to stay up to date on breaking news coverage